You are here
Summary of CBO’s Preliminary Analysis of the President’s Fiscal Year 2013 Budget
The Congressional Budget Office's (CBO) An Analysis of the President's FY 2013 Budget is yet another indication from the nonpartisan budget office that the nation continues to face serious long-term fiscal challenges. If the President's proposals were adopted, CBO estimates that:
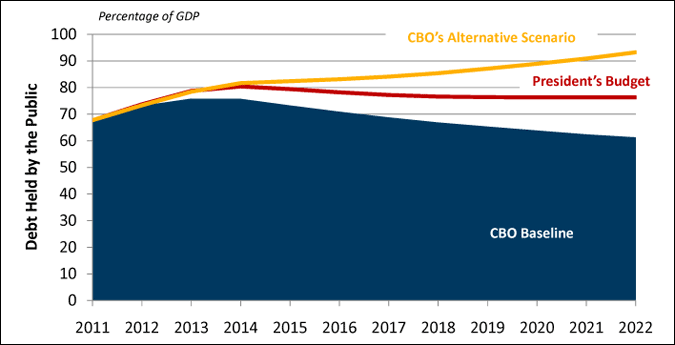
- Federal debt would peak at 80 percent of gross domestic product (GDP) in 2014—the highest level in more than 60 years—before declining modestly to 76 percent in 2020-2022, which would still be higher than any year since 1950.
- Federal deficits will total $6.4 trillion over the next 10 years—$3.5 trillion more than they would be under current law.
- Interest costs will climb from 6 percent of total outlays in 2013 to 13 percent in 2022.
This outlook is particularly worrisome because the baby boom generation is beginning to retire and will place growing demands on Social Security, Medicare, and Medicaid in the 2020s. Starting that decade with a historically high level of debt—and no plan for addressing our long-term demographic and health spending challenges—is risky. Indeed, the President's own projections, which many consider optimistic, show that debt will exceed 90 percent of GDP by 2035—a level that economists Kenneth Rogoff and Carmen Reinhart have shown can jeopardize economic growth and make economic crises more likely. To avoid those outcomes, policymakers will need to enact a long-term fiscal plan that addresses our structural deficits with policy changes that are phased in gradually as our economy recovers from recession.
What is the Outlook for Debt and Deficits under the President's Budget?
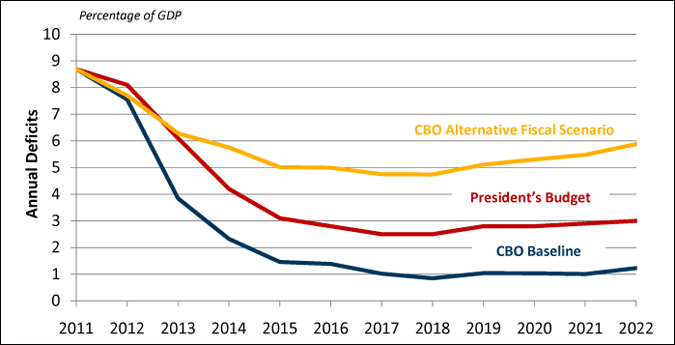
In its latest analysis, CBO projects that as the economy recovers, deficits under the President's budget proposals would decline from 6.1 percent of GDP in 2013 to 2.5 percent of GDP in 2017 and 2018. Then, after 5 years of improvement, CBO estimates that deficits would begin to creep back up and reach 3.0 percent of GDP in 2022.
The President's policies would produce annual deficits that are higher than the CBO baseline but lower than CBO's alternative fiscal scenario
Percentage of GDP

SOURCE: Data from the Congressional Budget Office, An Analysis of the President's 2013 Budget, March 2012; and the Congressional Budget Office, Updated Budget Projections: Fiscal Years 2012 to 2022, March 2012. Compiled by PGPF.
Would the President's policies improve the nation's fiscal outlook? To help answer that question, CBO compares the President's budget to two benchmarks: the CBO baseline, which reflects current law, including the expiration of certain popular policies such as the 2001/2003 individual income tax cuts; and an "alternative fiscal scenario" that assumes that the Congress and the President will act to extend such policies. The deficits and debt projected in this alternative scenario are significantly higher than in the CBO baseline.[i]
Compared to the alternative fiscal scenario, deficits under the President's proposal would be $4.3 trillion lower over the 10-year projection period. However, relative to CBO's baseline, the President's budget would result in $3.5 trillion more in cumulative deficits from 2013-2022. Indeed, if policymakers simply maintained current law and did not make any additional changes to the nation's budget policies, the deficit would decline to 1.2 percent of GDP in 2022—less than half what it would be under the President's budget.
CBO's analysis of the President's 2013 budget
Percentage of GDP
| 2012 | 2013 | 2022 |
10-Year Total 2013-2022 |
|
|---|---|---|---|---|
| Revenue | 15.4 | 17.2 | 19.8 | 19.4 |
| Spending | 23.5 | 23.4 | 22.8 | 22.5 |
| Deficits | 8.1 | 6.1 | 3.0 | 3.2 |
| Debt | 73.7 | 78.7 | 76.3 | n.a. |
SOURCE: Data from the Congressional Budget Office, An Analysis of the President's 2013 Budget, March 2012. Compiled by PGPF.
Due to these sustained deficits, CBO projects that the federal debt under the President's budget would rise from $11 trillion (74 percent of GDP) this year to $19 trillion (76 percent of GDP) in 2022. By contrast, if policymakers simply maintained current law, CBO projects that the debt would decrease to 61 percent of GDP in 2022.
Why Does the Debt Increase?
Most of the net budgetary impact of the President's budget stems from changes in tax policies, according to CBO. Relative to baseline estimates of current law, the administration's tax policies would reduce revenues by $2.4 trillion from 2013 to 2022.
CBO's estimates of the deficit impact of the President's 2013budget proposals
Billions of dollars
| 2013 | 2013-2022 | |
|---|---|---|
| Current law baseline deficits | 612 | 2,887 |
| Revenue adjustments | ||
| Extending income tax cuts for households earning less than $250,000 | 108 | 2,077 |
| Index the AMT starting at 2011 levels | 94 | 855 |
| Cap the amount that deductions can reduce tax liabilities | -19 | -523 |
| Other tax adjustments (net) | 44 | -55 |
| Total effect of revenue changes on deficits | 228 | 2,354 |
| Outlay adjustments | ||
| Mandatory programs | 93 | 1,163 |
| Discretionary programs | 41 | -598 |
| Net interest | 4 | 586 |
| Total effect of outlay changes on deficits | 137 | 1,150 |
| Total effects of the President's policies on deficits | 365 | 3,504 |
| Deficits under the President's policies | 977 | 6,390 |
SOURCE: Data from the Congressional Budget Office, An Analysis of the President's 2013 Budget, March 2012. Compiled by PGPF.
NOTE: A positive number indicates that the budget policies increase the deficit; a negative number indicated that they reduce the deficit. Totals may not add due to rounding.
The most important tax policy change in the President's budget would be a permanent extension of the 2001/2003 tax cuts for families with incomes under $250,000 and individuals with incomes below $200,000. Extending those provisions would reduce revenues by $2.1 trillion over the next ten years. The President also proposes to index the thresholds at which taxpayers are subject to the Alternative Minimum Tax (AMT) to inflation and reduce the number of taxpayers who would otherwise be subject to the AMT. Those reductions would be partially offset by other policy changes: the largest revenue-raiser would be a limit on the value of deductions and exclusions that high-income taxpayers can claim if they itemize.
On the spending side of the budget, the President's budget would increase outlays by $1.2 trillion over the next ten years. Programmatic spending would rise largely because the President proposes to: eliminate the automatic spending reductions that are scheduled to go into effect as a result of the Budget Control Act of 2011; extend and expand certain refundable tax credits (which are classified as outlays in the budget); and prevent physician reimbursements rates from being sharply reduced as scheduled under current law. Those increases would be partially offset by savings from the reductions in projected military spending on overseas contingency operations and changes in Medicare that would reduce payments to providers and modify cost-sharing responsibilities for certain beneficiaries.
Spending would also increase because of higher interest costs. Over the next ten years, the federal government would continue to borrow to finance its activities, significantly raising the burden of servicing the nation's debt. According to CBO's analysis of the President's budget, net interest payments on the federal debt would triple in nominal dollars over the next 10 years—growing from $237 billion in 2013 to $743 billion in 2022. Interest costs would absorb a bigger share of total spending: net interest on the federal debt is projected to rise from 6 percent of total spending in 2013 to 13 percent in 2022.
What are the Long-Run Implications?
The first baby boomers are beginning to retire, and during the 2020s spending on Social Security and federal health programs will grow steadily, while revenues will fail to keep pace, leading to growing deficits and debt. Failing to address that gap between spending and revenues could do great harm to our families, our businesses, and our economy in the years ahead.
Under CBO's analysis of the President's 2013 budget, debt is still on an unsustainable trajectory
Percentage of GDP

SOURCE: Data from the Congressional Budget Office, An Analysis of the President's 2013 Budget, March 2012; and the Congressional Budget Office, Updated Budget Projections: Fiscal Years 2012 to 2022, March 2012. Compiled by PGPF.
Although the CBO analysis is limited to a 10-year horizon, the President's budget documents show that under his policies, debt would continue to grow in the following decades, eventually surpassing 90 percent of GDP by 2035. That projection is worrisome given that debts above 90 percent of GDP can jeopardize economic growth and make economic crises more likely.
Although any action on the budget must acknowledge the current fragility of our economy, policymakers could significantly improve the outlook for the budget and economy by creating a credible plan to reduce the deficit gradually over time as the economy recovers. But focusing on the ten-year budget window will not be enough; we will need a fiscal plan that addresses the long-term structural challenges our nation will face from the aging of our population and the relentless growth of health care costs.
[i] The alternative fiscal scenario assumes the following: Expiring tax provisions (other than the current reduction in the payroll tax rate for Social Security) are extended; the AMT is indexed for inflation after 2011; Medicare's physician payment rates are held at their current level; and automatic spending reductions required by the Budget Control Act set to take effect in January 2013 do not occur (although the discretionary spending caps in that law are assumed to remain in place).
