You are here
Fiscal Year 2013 Budget Proposals
In the last few days, members of Congress have introduced a number of alternative budget proposals for fiscal year (FY) 2013. Each proposal presents a distinct vision of the role of the federal government in our economy. Some envision a smaller government with lower taxes; others propose new investments and the taxes needed to finance them. The proposals also differ significantly in the extent to which they grapple with the nation's deficit over the next 10 years, but the proposals share a common goal: restoring fiscal restraint over the medium term.
However, a 10-year focus is not enough; the real fiscal challenge facing the nation will become evident in the subsequent decade, as the baby boomers retire in large numbers and health care costs continue to grow. This package of charts examines proposals from House Republicans and Democrats, the Congressional Progressive Caucus, and a bipartisan plan proposed by Representatives Jim Cooper and Steven LaTourette. Although the proposals span a wide range of political views, they show that it is possible to design fiscal plans to reduce our budget deficits.
Comparison of fiscal year 2013 budget resolutions
Percent of GDP
| CBO Baseline (Current Law) | President | House Democrats | House Republicans | Progressive Caucus | Cooper-LaTourette | |||||||
|---|---|---|---|---|---|---|---|---|---|---|---|---|
| 2013 | 2012 | 2013 | 2022 | 2013 | 2022 | 2013 | 2022 | 2013 | 2022 | 2013 | 2022 | |
| Revenue | 18.7 | 21.2 | 17.2 | 19.8 | 17.2 | 19.7 | 17.2 | 18.7 | 18.2 | 22.6 | 17.3 | 19.9 |
| Outlays | 22.5 | 22.4 | 23.4 | 22.8 | 23.3 | 22.5 | 22.2 | 19.8 | 24.7 | 23.3 | 22.3 | 21.3 |
| Deficits | 3.8 | 1.2 | 6.1 | 3.0 | 6.1 | 2.7 | 5.0 | 1.2 | 6.5 | 0.7 | 5.0 | 1.4 |
| Debt | 75.8 | 61.3 | 78.7 | 76.3 | 78.5 | 74.3 | 77.0 | 62.3 | 79.5 | 62.3 | 77.1 | 67.9 |
SOURCE: Data from the House Budget Committee, The Path to Prosperity: A Blueprint for American Renewal, March 2012; House Budget Committee, Summary of the 2013 Democratic Budget, March 2012; Congressional Progressive Caucus, The Budget for All, March 2012; Congressional Budget Office, Updated Budget Projections: Fiscal Years 2012 to 2022, March 2012; and the Congressional Budget Office, An Analysis of the President's 2013 Budget, March 2012; and the Office of Jim Cooper, March 2012. Compiled by PGPF.
Deficits and Debt
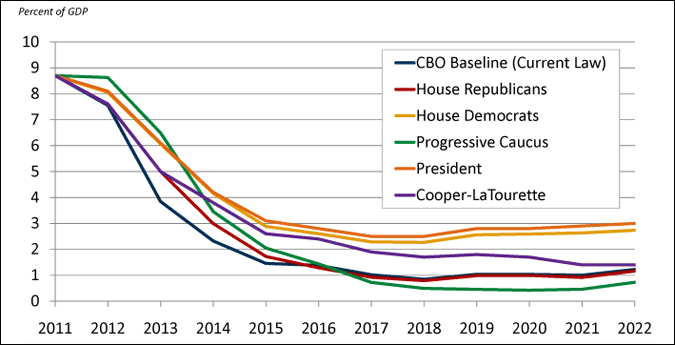
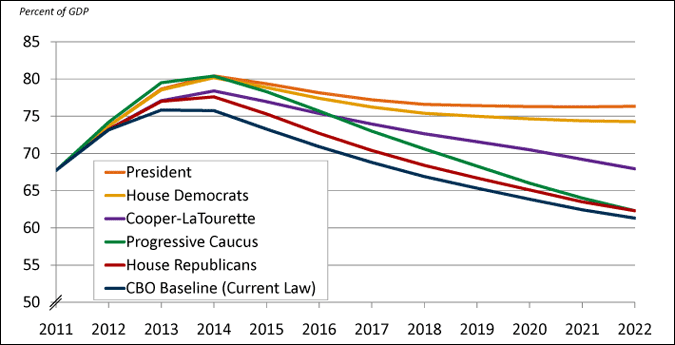
The budget proposals of the Progressive Caucus and House Republicans significantly reduce deficits and bring debt down to about 62 percent of gross domestic product (GDP) by 2022. The Cooper-LaTourette plan also reduces deficits, but debt would only drop slightly below current levels by 2022. The President and House Democrats proposals reduce deficits by smaller amounts and, as a result, debt rises from current levels to about 75 percent of GDP in 2022, which would be its highest level since 1950. This outlook is particularly worrisome because debt would be high at a time when large numbers of baby boomers will be retiring, becoming eligible for Social Security and Medicare and placing new demands on those programs. Combined with the continued fast growth of health costs, entitlement spending is expected to surge in the decade after 2022. Starting that decade with a historically high level of debt is risky.
Deficits under fiscal year 2013 budget plans
Percent of GDP

SOURCE: Data from the House Budget Committee, The Path to Prosperity: A Blueprint for American Renewal, March 2012; House Budget Committee, Summary of the Democratic Budget, March 2012; Congressional Progressive Caucus, The Budget for All, March 2012; Congressional Budget Office, Updated Budget Projections: Fiscal Years 2012 to 2022, March 2012; the Congressional Budget Office, An Analysis of the President's 2013 Budget, March 2012; and the Office of Jim Cooper, March 2012. Compiled by PGPF.
Debt held by the public under fiscal year 2013 budget plans
Percent of GDP

SOURCE: Data from the House Budget Committee, The Path to Prosperity: A Blueprint for American Renewal, March 2012; House Budget Committee, Summary of the Democratic Budget, March 2012; Congressional Progressive Caucus, The Budget for All, March 2012; Congressional Budget Office, Updated Budget Projections: Fiscal Years 2012 to 2022, March 2012; the Congressional Budget Office, An Analysis of the President's 2013 Budget, March 2012; and the Office of Jim Cooper, March 2012. Compiled by PGPF.
Revenues and Outlays
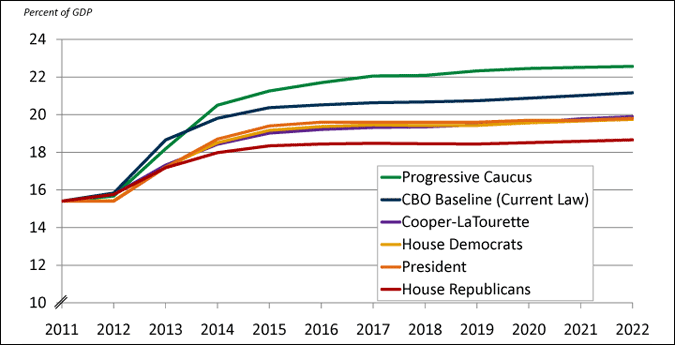
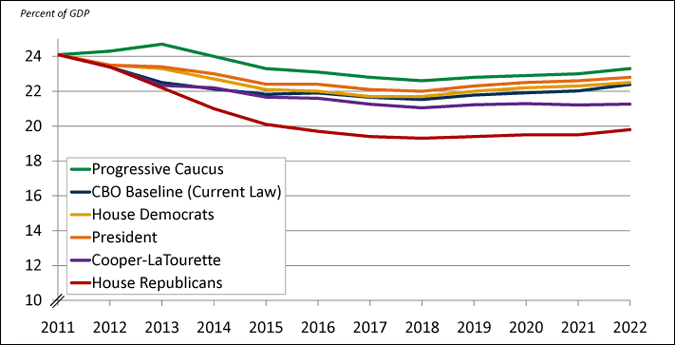
The House Republican and Progressive Caucus plans reduce the debt through different approaches. The Progressive Caucus plan raises taxes and spending well above current law and historical averages. The House Republican's proposal, by contrast, achieves roughly the same debt reduction over 10 years by reducing outlays far below current law and holding revenues at a low level. Reducing spending to those levels when baby boomers are retiring will require major changes in the role of government. Spending and revenues in the other plans fall between the Progressive Caucus and House Republicans proposals.
Revenues under fiscal year 2013 budget plans
Percent of GDP

SOURCE: Data from the House Budget Committee, The Path to Prosperity: A Blueprint for American Renewal, March 2012; House Budget Committee, Summary of the Democratic Budget, March 2012; Congressional Progressive Caucus, The Budget for All, March 2012; Congressional Budget Office, Updated Budget Projections: Fiscal Years 2012 to 2022, March 2012; the Congressional Budget Office, An Analysis of the President's 2013 Budget, March 2012; and the Office of Jim Cooper, March 2012. Compiled by PGPF.
Outlays under fiscal year 2013 budget plans
Percent of GDP

SOURCE: Data from the House Budget Committee, The Path to Prosperity: A Blueprint for American Renewal, March 2012; House Budget Committee, Summary of the Democratic Budget, March 2012; Congressional Progressive Caucus, The Budget for All, March 2012; Congressional Budget Office, Updated Budget Projections: Fiscal Years 2012 to 2022, March 2012; the Congressional Budget Office, An Analysis of the President's 2013 Budget, March 2012; and the Office of Jim Cooper, March 2012. Compiled by PGPF.
