You are here
Analysis of CBO’s Budget Outlook: Fiscal Years 2012–2022
INTRODUCTION
The Congressional Budget Office's (CBO) latest Budget and Economic Outlook provides sobering new evidence that our nation's fiscal policies are on an unsustainable and uncertain path. This reflects the ongoing weakness in our economy in the near term, and policymakers' inability to agree on how to address the budget's structural problems over the long term.
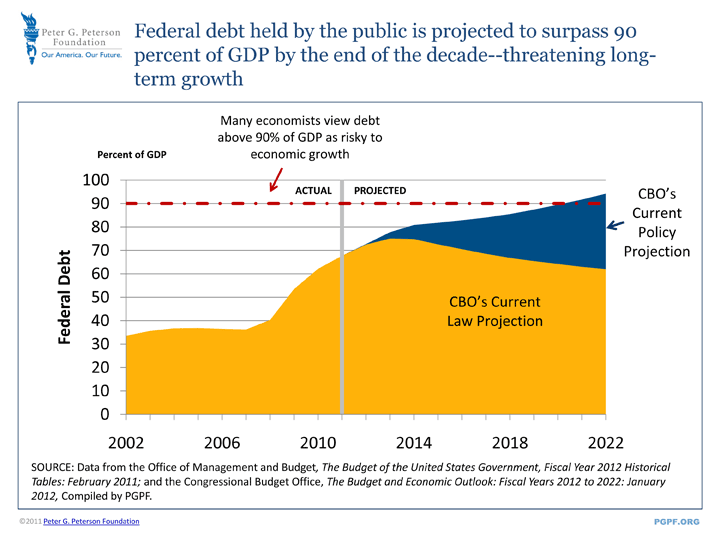
In its report, CBO provides two perspectives of the budget through 2022. Under the current law baseline, the federal debt would rise from 72 percent of gross domestic product (GDP) to 75 percent in 2013 and 2014, and then fall to 62 percent in 2022 as recovery gradually takes hold and economic improvement outpaces the growth in debt. Even so, that debt level is significantly higher than the 38 percent of GDP seen, on average, since 1972. Moreover, that outlook assumes that the President and Congress will allow several popular policies--including the 2001/2003/2009 individual income tax cuts--to expire as scheduled under current law, and that discretionary spending would fall to 5.6 percent of GDP, about two-thirds of the average level for both defense and non-defense programs over the last 40 years.
Because lawmakers are generally expected to reject such changes, CBO provides an alternative baseline that assumes that many current policies continue. Under this current-policy scenario, the fiscal outlook is bleak. Over the next decade, the debt would climb to 94 percent of GDP, a level that many economists believe is risky to economic growth. This increase in debt results in an almost tripling of interest costs as a percentage of the economy, rising from 1.4 percent of GDP this year to 3.8 percent by 2022.
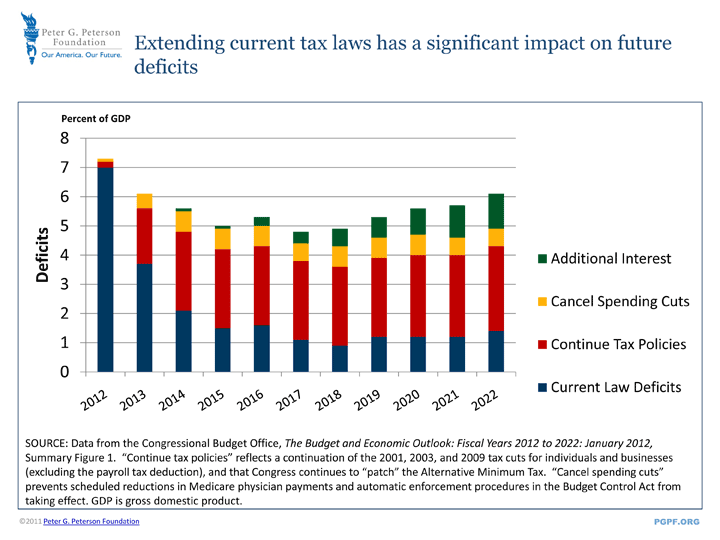
CBO's two sets of projections provide important insights into the decisions that lie ahead for lawmakers. Under current laws, annual deficits would decline and debt as a share of the economy would stabilize over the next 10 years. Under the policies outlined in the current-policy scenario, most of which the Congress and President have repeatedly endorsed, deficits would average $1.1 trillion over the next 10 years, adding $8 trillion to the debt.
Billions of dollars
|
10-year total: 2013-2022 |
|
|---|---|
| Current law deficits | -3,072 |
| Adjustments | |
| Medicare "doc fix" | -316 |
| Extend 2001/2003/2009 tax cuts | -4,564 |
| Extend other expiring tax provisions | -839 |
| No automatic spending cuts as required by the Budget Control Act | -984 |
| Debt service | -1,206 |
| Subtotal | -7,909 |
| Current policy deficits | -10,981 |
SOURCE: Data from the Congressional Budget Office, The Budget and Economic Outlook: Fiscal Years 2012 to 2022: January 2012. Compiled by PGPF.
CBO warns that federal debt will climb in the years after 2022, under either current law or current policy. "Because of the aging of the population and rising costs for health care, the set of budget policies that were in effect in the past cannot be maintained in the future," CBO concludes. Without policy changes, federal deficits will rise sharply, and that this will restrict the ability of policymakers to respond to future challenges, lower domestic investment, dampen economic growth, and "boost the likelihood of a sudden fiscal crisis."
Action will be needed. In designing a sustainable policy, budget experts focus on stabilizing the ratio of debt to GDP in the long run. The foundation estimates that to prevent the debt ratio in 2022 from exceeding its level in 2012, policymakers would have to reduce cumulative 10-year deficits by $5.3 trillion from CBO's current-policy baseline.[i] By comparison, the extension of all expiring tax cuts will raise the budget deficit by $6.4 trillion.
To meet that $5.3 trillion target, policymakers will need to focus on revenues and entitlements. No other areas on the spending side of the budget are growing and, in fact, the constraints on discretionary spending set by the Budget Control Act of 2011 are so tight that many budget experts think that they will not be maintained.
THE ECONOMIC OUTLOOK
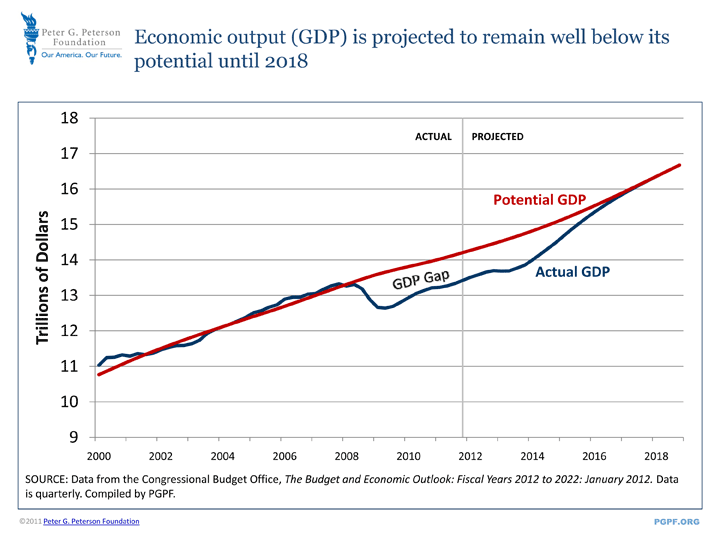
CBO projects that the U.S. economy will continue to struggle with high unemployment and sluggish growth for several more years. The agency projects that economic output will remain below its potential until 2018--more than a decade since the start of the recession in December of 2007--and that the unemployment rate will remain above 7 percent until 2015.
The cumulative shortfall in economic activity is immense. From 2007 to 2018, CBO estimates that the economy will have lost $5.7 trillion from the recession and the weak recovery. About $2.6 trillion of that amount has already been lost; the remaining $3.1 trillion is projected to be lost over the next 6 years.
Recent high unemployment rates have been largely due to a decline in demand for goods and services and the workers who produce them. CBO estimates that 70 percent of the rise of the unemployment rate since the onset of the recession is due to weak demand.
The remaining rise in the unemployment rate is due to structural factors. Those factors include the mismatch between the skills of the unemployed and the requirements of employers looking to hire, the difficulty of workers who have been unemployed for long periods to find and hold new jobs, and the effect of extended unemployment insurance in discouraging job search. Of the three factors, the skills mismatch is the most important in explaining structural unemployment.
CBO sees little inflation in the outlook. The inflation rate (as measured by the price index for personal consumption expenditures) is projected to be 1.2 percent in 2012 and averages only 1.7 percent for next 5 years.
The near-term outlook for the economy is clouded by policy uncertainty. Under current law, several tax cuts expire and spending will become more restrained next year. Combined with a slow recovery, those changes will reduce the growth of real GDP to 1.1 percent in 2013. However, if those tax cuts were extended and spending restrictions were lifted, CBO estimates that real GDP could grow 1.4 percent to 4.1 percent next year.
Economic Outlook Under Current Law
In percent
| 2012 | 2013 | 2014-2017 | 2018-2021 | |
|---|---|---|---|---|
| Real Annual GDP Growth | 2.0 | 1.1 | 4.1 | 2.5 |
| Unemployment Rate | 8.8 | 9.1 | 7.0 | 5.4 |
| Inflation Rate | 1.2 | 1.3 | 1.7 | 2.0 |
| Three-month Treasury Rate | 0.1 | 0.1 | 2.0 | 3.7 |
| Ten-Year Treasury Rate | 2.3 | 2.5 | 3.8 | 5.0 |
SOURCE: Data from the Congressional Budget Office, The Budget and Economic Outlook: Fiscal Years 2012 to 2022: January 2012, Table 2-1. Compiled by PGPF.
NOTE: Inflation index used is the PCE price index
Softening the economic losses of the expiring tax cuts does not require policymakers to permanently extend them. In fact, CBO shows that a permanent extension would eventually slow economic growth as higher deficits crowd out private investment in productive capital. Instead, what is needed is a tax policy that balances short-run and long-run economic concerns. Too much deficit reduction when the economy is weak is risky for growth; but too little deficit reduction when the economy is strong also undermines growth.
Thus, the economic outlook highlights the importance of reducing policy uncertainty by adopting a long-term plan to reduce the deficit gradually over time after the economy has recovered. By putting our long-term deficit on a sustainable path, such a plan would boost confidence in our economy today and help the recovery. Moreover, by focusing on the long term, we can reduce excessive reliance on near-term deficit reduction that risks slowing economic growth.
[i] That is less than the total 10-year deficits of $11 trillion for the current-policy scenario because GDP will be growing over the same period.
THE BUDGET OUTLOOK
CBO Budget Projections
Percentage of GDP
| Actual, 2011 | 2012 | 2013 | 2022 | |
|---|---|---|---|---|
| Current Law Projections | ||||
| Revenue | 15.4 | 16.3 | 18.8 | 21.0 |
| Spending | ||||
| Mandatory | 13.5 | 13.3 | 13.3 | 14.3 |
| Discretionary | 9.0 | 8.4 | 7.7 | 5.6 |
| Net Interest | 1.5 | 1.4 | 1.5 | 2.5 |
| Total | 24.1 | 23.2 | 22.5 | 22.4 |
| Deficits | -8.7 | -7.0 | -3.7 | -1.4 |
| Debt held by the public | 67.7 | 72.5 | 75.1 | 62.0 |
| Current Policy Projections | ||||
| Deficits | n.a | -7.2 | -6.2 | -6.1 |
| Debt held by the public | n.a | 72.7 | 77.8 | 94.2 |
SOURCE: Data from the Congressional Budget Office, The Budget and Economic Outlook: Fiscal Years 2012 to 2022: January 2012, Tables 1-3 and 1-7. GDP is gross domestic product. Compiled by PGPF.
DISCRETIONARY SPENDING
Discretionary spending results from annual appropriations legislation. The programs in this category of federal spending, representing 40 percent of the budget for 2012, are some of the most recognizable (other than individual benefit programs), and include national defense, veterans' assistance, the Congress, the White House, the Supreme Court, national parks, law enforcement, education, research and development, and investments in physical infrastructure.
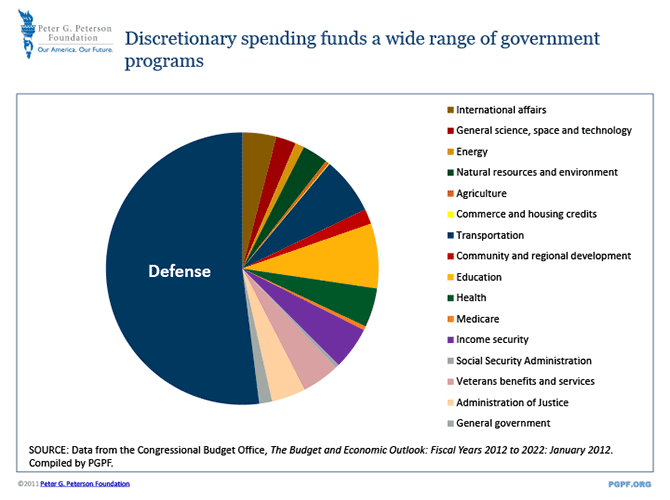
Under current law, this area of the budget is projected to change dramatically. CBO projects that discretionary spending will fall from 8.4 percent of GDP in 2012 to 5.6 percent of GDP by 2022--the lowest level in 50 years. These trends result largely from the Budget Control Act of 2011 (BCA), which was designed to achieve $2.1 trillion in deficit reduction through two measures:
- Imposing spending caps to reduce discretionary spending through 2021
- Creating a "super committee" to come up with additional deficit reduction
Because the "super committee" failed to agree on a package of deficit reduction policies, the BCA's fallback procedure will mandate automatic spending cuts beginning in January 2013 to achieve $1.2 trillion in deficit reduction over the next nine years. About 83 percent of those automatic cuts will come from discretionary spending.
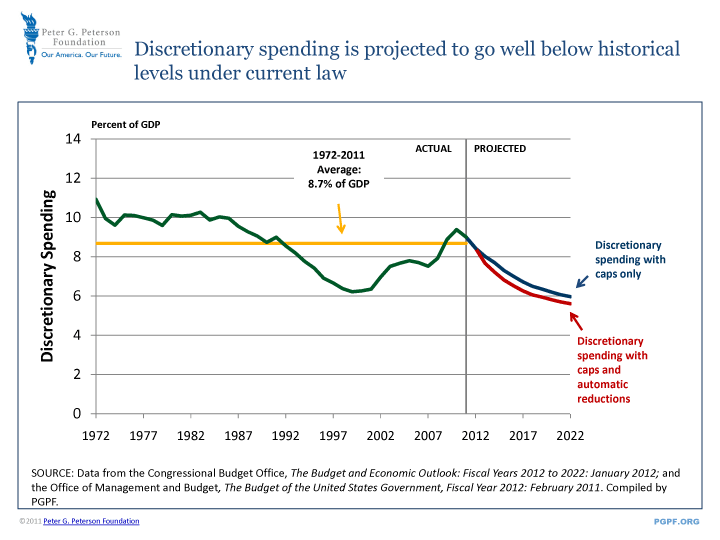
Although the BCA did achieve some deficit reduction, it pushes future discretionary spending to levels so low that it may not be sustainable politically. Discretionary spending funds programs that help promote economic growth, such as education, research and development, and infrastructure, as well as defense programs that protect our national security.
More fundamentally, the BCA did not address the main driver of long-term structural deficits. The U.S. cannot solve its long-term budget challenges through cuts to discretionary spending alone. Lasting, bipartisan reform will require rethinking entitlement spending and revenue policies.
SOCIAL SECURITY
Social Security is the largest single program in the federal budget. In 2011, the program paid over $725 billion in benefits to retirees, surviving spouses and their families, and those claiming the disability benefit. By 2022, CBO estimates that spending on Social Security will climb to $1.3 trillion. Social Security will account for a significant share of the growth of federal spending over the next ten years. From 2012 to 2022, Social Security spending will increase by $575 billion, or 30 percent of the increase in total federal spending over the same period. As a share of the economy, Social Security spending will increase by 10 percent over the next decade from 5 percent of GDP in 2012 to 5.5 percent of GDP in 2022. The projected rise in Social Security spending comes as no surprise. It reflects demographic trends that have been in place for a long time. As a result of the retirement of the Baby Boom generation, CBO estimates that the share of population aged 65 and older will increase by a third over the next 10 years.
HEALTH CARE
CBO projects that federal health spending will continue to be the fastest growing area of federal spending, increasing at an average rate of 8 percent per year over the next decade. By contrast, GDP is expected to grow at the average annual rate of 4.5 percent over that same time. By 2022, health spending will represent one-third of the total budget, compared to less than one-fourth this year.
Despite this high level of projected growth, many of the assumptions underlying CBO's projections are conservative. Under current law, Medicare physicians face a 27 percent reduction in fees in March 2012 as a result of the program's "sustainable growth rate" (SGR) payment formula. Lawmakers have overridden the SGR reductions every year since 2003: if they do so again, CBO projects that Medicare outlays would increase by an additional $316 billion over the decade.
Additionally, the baseline incorporates provisions of the 2010 health care reform act (the Patient Protection and Affordable Care Act--or PPACA) that would expand Medicaid, provide subsidies for health insurance coverage, and, if implemented and maintained as designed, restrain the growth of Medicare payments to health care providers. Policy experts have expressed skepticism about the sustainability of many of the constraints on the growth in payments to health care providers. Critics have also challenged new efforts--including the Independent Payment Advisory Board and the Medicare Innovation Center--that are intended to develop reforms to reduce the growth in Medicare costs.
Under either of CBO's baseline scenarios, health care programs--many of which face the dual drivers of the aging of the Baby Boom generation and the excess growth in overall health care costs--remain the fastest growing area of the federal budget and pose the greatest challenge to the long-term fiscal condition.
CBO Word Cloud

NOTE: This "Word Cloud" was developed on Wordle.net and features the most frequently used terms in the CBO report.
REVENUES
Policy uncertainty hangs over the fiscal and economic outlook, and CBO's report highlights that the nation's tax policy presents the largest set of unresolved issues facing policymakers this year.
Under current law, a large number of tax provisions will expire at the end of this year. The most significant expirations are the tax cuts that were initially passed in 2001, 2003, and 2009 and extended in 2010. Those tax cuts created a new 10 percent tax bracket, reduced the four highest statutory tax rates, lowered tax rates on capital gains and dividends, expanded credits for children and higher-education expenses, offered marriage penalty relief, and reduced estate and gift taxation. The temporary "patch" to the Alternative Minimum Tax (AMT) also expired at the end of 2011, and unless it is extended this year the number of taxpayers subject to the AMT will jump from 4 million to 30 million. Further, there are several other provisions in the tax code that will expire this year, such as the credit for R&D spending carried out by business.
If current law is followed, CBO projects that revenues will increase from 15 percent of GDP in 2011 to 21 percent of GDP in 2022. Although a significant amount of that increase is due to an improved economy over this period, about half of the gain is due to the expiration of the tax cuts.[ii]
Few people expect that Congress and the President will allow all of the tax cuts to expire, however, because many of those provisions have been routinely extended in the past. And the weak economy may provide further justification for another temporary extension of some of the cuts. If the tax cuts are permanently extended, CBO projects that revenues would rise to only 18.3 percent of GDP by 2022. However, the costs of extending all of the tax cuts permanently would be large and would significantly add to our long-term structural deficits.
Indeed, policymakers will be facing a $6 trillion decision about tax policy this year. If all the expiring provisions are extended, CBO estimates that cumulative deficits (including debt service) will rise by $6.4 trillion over the next 10 years. Of that amount, $5.4 trillion is due to the expiration of the tax cuts initially passed in 2001, 2003 and 2009 and the AMT patch. By comparison, we estimate that the ratio of debt to GDP could be stabilized at 2012 levels by reducing deficits by $5.3 trillion.
Policymakers have another near-term tax issue to consider. In late 2011, the Congress passed and the President signed legislation that extended a reduction in the employees' share of the payroll tax rate from 6.2 percent to 4.2 percent. This cut expires at the end of February 2012. If policymakers extended the tax cut for the rest of calendar year 2012, it would reduce revenues by $75 billion in fiscal year 2012 and by $25 billion in fiscal year 2013. Though the temporary payroll tax cut will provide direct tax relief to workers, this policy represents a break in the long-standing connection between Social Security benefits and payroll contributions.
CBO's report draws attention to the issue of tax expenditures, or the exemptions, credits and deductions that subsidize various activities. In 2012, CBO estimates that the major tax expenditures in the individual income tax code reduced federal revenues by $800 billion, or about a third of total revenues. To put those tax subsidies in perspective, the government spent more on them than it did on Social Security or Medicare or defense, individually. Over the ten-year period, CBO estimates that these tax expenditures will total nearly $12 trillion, or 5.8 percent of GDP.
CONCLUSION
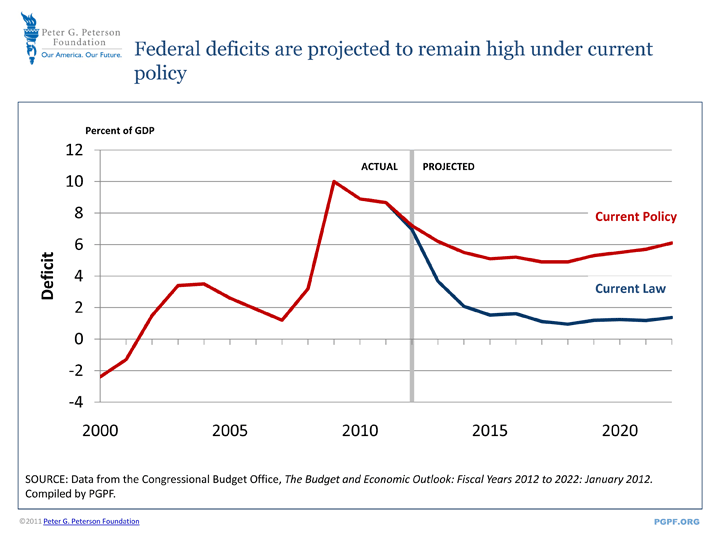
Although America's current budget picture is troubling, the real threat to America's future lies in the decades after the next ten years. If current policies are not changed and our long-term structural deficits are not tamed, we face a dismal future of unsustainable growth in debt and interest costs that will undermine our future prosperity. To address our long-term fiscal and economic challenges effectively, we need a bipartisan plan that tackles all of the major unsustainable areas of the federal budget. We need a set of sound and sustainable fiscal policies that are implemented gradually after our economy recovers. The nation cannot afford for lawmakers to take a year off due to the election season. It is time for elected officials from both parties to show leadership by putting our country on a path to economic prosperity and fiscal sustainability.
[ii] Under current law (in which the tax cuts expire), revenues as a share of GDP rise by 5.6 percentage points from 2011 to 2022. Under current policy (in which the tax cuts are extended), the revenue share rises by 2.9 percentage points over the same period. Thus, the expiration of the tax cuts accounts for about half of the rise in the revenue share.
