You are here
FY 2017 Budgets: Comparing the House Budget Committee Resolution and the President's Budget
Last week, the House Budget Committee passed its budget resolution on a strict party-line vote. This budget follows President Obama’s budget, which the Administration released last month. The two budgets present distinctly different visions of policy priorities and the role of the federal government.
The House Budget Committee’s budget is not scheduled for a full House vote. In addition, the Senate Budget Committee has postponed action on its 2017 budget resolution. Failing to pass a budget resolution in Congress would represent a missed opportunity to discuss and illuminate the tough choices necessary to address America’s fiscal challenges.
How do the House Budget and the President’s Budget differ?
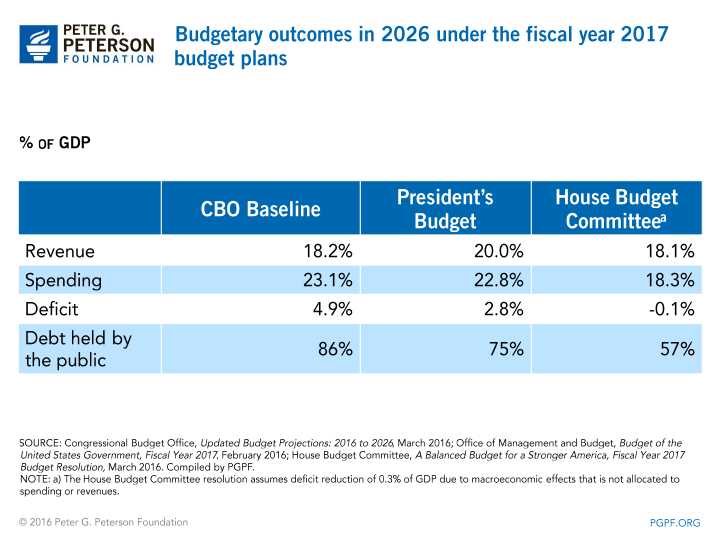
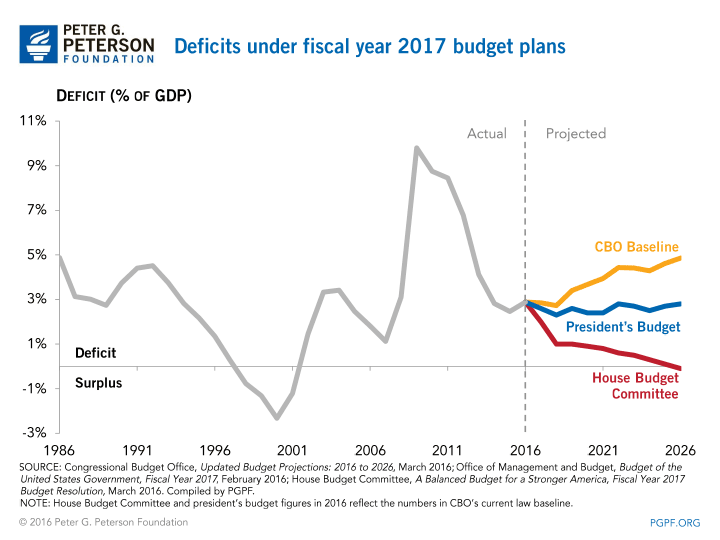
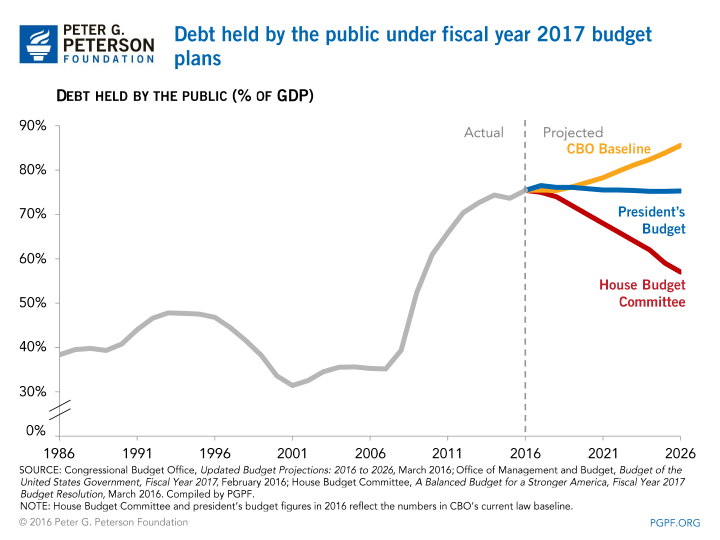
The House Budget Committee plan proposes to bring deficits down to below one percent of gross domestic product (GDP) by 2020 and balances the budget by 2026. The plan achieves deficit reduction entirely through policies that cut spending, with 30 percent of these cuts coming from the repeal of the Affordable Care Act (“Obamacare”), and an additional 23 percent of cuts coming from savings in major health programs. By 2026, debt held by the public would fall to 57 percent of GDP — well below the current level of 75 percent.
The president’s proposal would keep deficits relatively steady as a share of GDP over the next decade. Under the president’s plan, higher taxes, reduced war spending, additional savings from health programs, and immigration reform hold annual budget deficits to just below 3 percent of GDP in each of the next ten years, and debt held by the public would remain at approximately 75 percent of GDP.
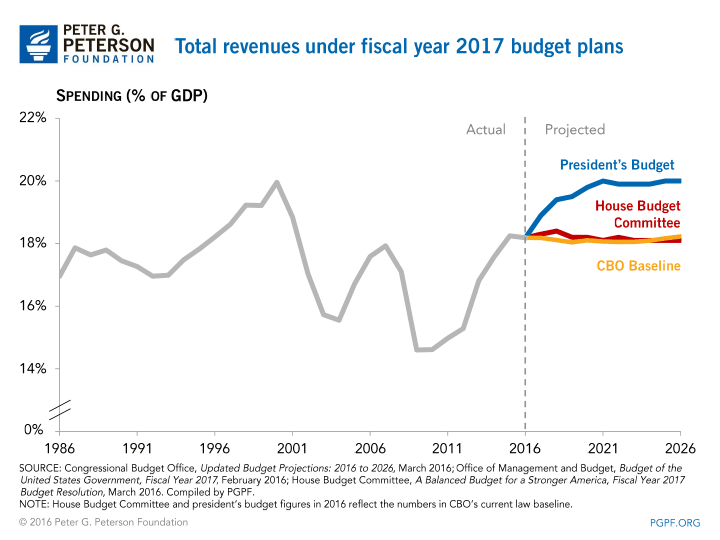
Under the House Budget Committee plan, revenues remain relatively steady over the 10-year period at 18.2 percent of GDP. The only proposal under the plan that affects revenues is the repeal of the Affordable Care Act. The assumption under the plan is that the removal of the insurance coverage mandate would increase incentives to work, resulting in increased revenues of $225 billion over the decade. The plan does not provide details on how it accounts for the substantial loss of revenues associated with repealing the tax components of the Affordable Care Act.
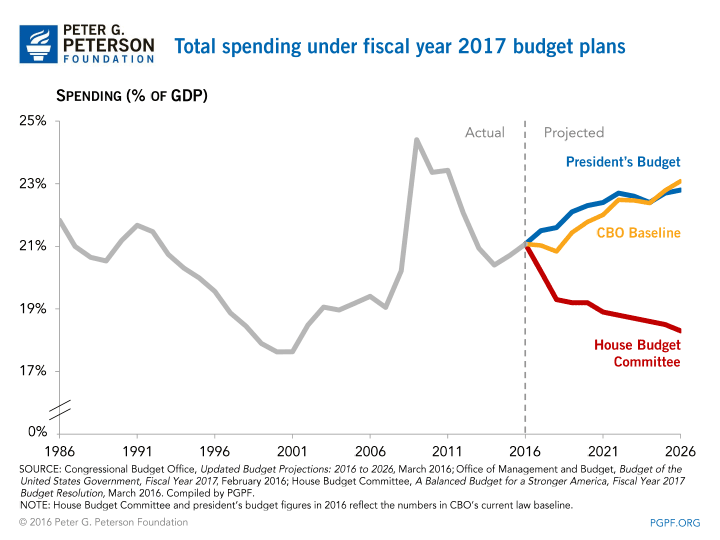
Compared to the House Budget Committee plan, the president’s proposal includes significantly higher revenues, growing from 18.2 percent of GDP in 2015 to 20.0 percent of GDP in 2026. That estimated growth in revenue stems from a variety of tax proposals that would impact businesses and individuals. In total, compared to the House Budget Committee Plan, the president’s plan includes 4.1 trillion more in revenues, but it would also spend $8.5 trillion more over the next 10 years. After accounting for these differences as well as interest costs under each plan, 10-year deficits under the Administration’s plan would be approximately $4.6 trillion higher than under the House Budget Committee plan.
Under both plans, interest costs on the debt would remain a significant expense. Under the President’s proposal, interest costs would be $5.8 trillion over the next 10 years, and $787 billion in 2026 alone. Under the House Budget Committee plan, interest costs would be $4.8 trillion over the next 10 years, with $591 billion in 2026 alone.
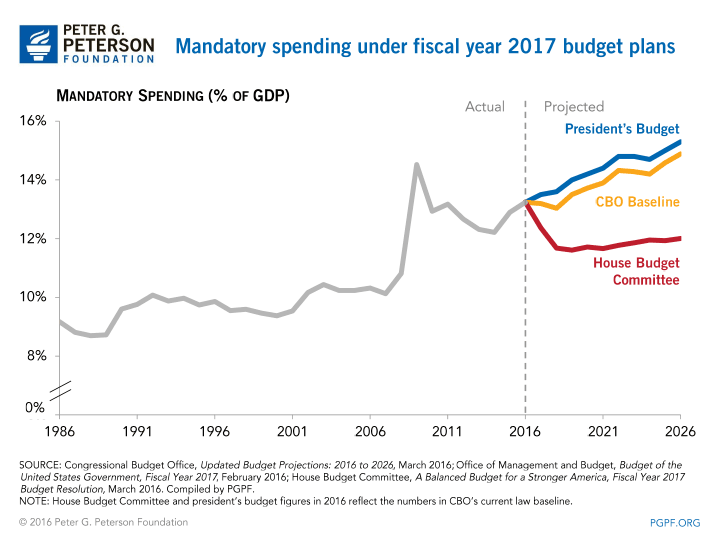
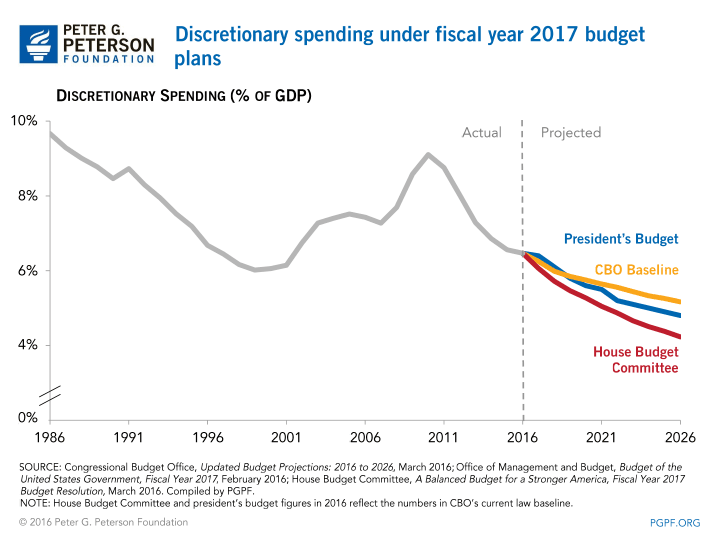
The charts below illustrate various budget trends over the coming decade under both proposals, and compare them with the most recent Congressional Budget Office 10-year budget baseline projections.
Even though it is the standard budgetary window, a 10-year perspective fails to present a full picture of America’s fiscal outlook. The primary drivers of America’s long-term debt — those which pose a fundamental threat to our economy — become more fully evident in the subsequent decade and thereafter. Over that longer period, America faces a number of structural fiscal challenges: baby boomers retiring in large numbers and living longer, growing healthcare costs and rising interest costs, combined with a tax system that raises insufficient revenue. All of these trends threaten to crowd out critical public and private investments, and put the nation at risk of a future fiscal crisis. It is essential for policymakers to develop plans that not only improve the fiscal outlook over the next ten years, but also put the nation’s debt on a sustainable path for the long term.
