Charts
May 24, 2023
Drivers of spending growth
Spending for mandatory programs and net interest is projected to putpace all other non-interest spending.
https://www.pgpf.org/chart-archive/0174_SS_major_health_climb

The search found 349 results in 0.221 seconds.
Spending for mandatory programs and net interest is projected to putpace all other non-interest spending.
https://www.pgpf.org/chart-archive/0174_SS_major_health_climb

The Trustees warn that Congress and the Administration should work "with a sense of urgency" to put the program on a sustainable path.
https://www.pgpf.org/analysis/the-medicare-trustees-report-in-charts
On our current path, CBO projects that deficits will reach $1.0 trillion by 2022 and total $10.1 trillion over the next ten years.
https://www.pgpf.org/analysis/2017/06/cbo-unsustainable-deficits-threaten-future-economic-growth
Spending on federal entitlement programs will more than double between 1991 and 2051.
https://www.pgpf.org/chart-archive/0027_entitlement-programs-proj
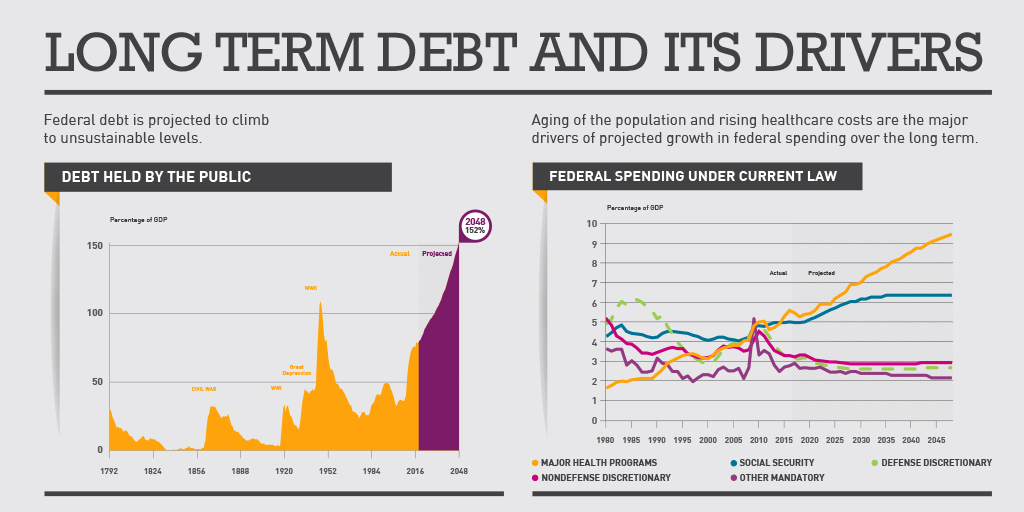
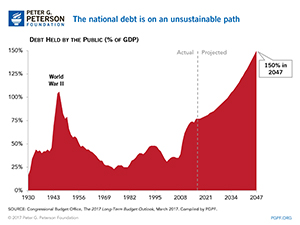
Putting our nation on a sustainable fiscal path creates a positive environment for growth, opportunity, and prosperity. Unfortunately, America is on a dangerous long-term fiscal path.
https://www.pgpf.org/infographic/infographic-why-long-term-debt-matters
Income growth since 1979 is larger for high-income earners, even when including transfers and taxes.
https://www.pgpf.org/chart-archive/0059_income-growth-disparity
Between 1979 and 2016, income increased more quickly for high-income earners.
https://www.pgpf.org/chart-archive/0060_income-disparity-before-transfers-taxes
Improving our healthcare system to deliver better quality care at lower cost is critically important to our nation’s long-term economic and fiscal well-being.
https://www.pgpf.org/infographic/infographic-us-healthcare-spending