You are here
Taxes Primer
Where does the money come from?
Each year, some of the revenue the federal government collects comes from various taxes. In 2012, taxpayers paid almost $2.5 trillion, which the government used to partially fund $3.5 trillion worth of spending on Social Security, health care, and other programs in areas such as defense and education. The remainder of spending was funded through deficits.
At around 15 percent of GDP, tax revenues in 2012 were relatively higher than they have been since the onset of the financial crisis, but still well below their 17 percent average over the past 40 years. As the economy continues to recover, revenues are projected to rise to 17.5 percent of GDP in 2013 and 19.1 percent in 2023. This sharp increase is a result of three factors: higher taxable incomes from a strengthening economy; increases in tax rates on high-income individuals, enacted as part of the American Taxpayer Relief Act (ATRA); and the expiration of a temporary cut in payroll tax rates.
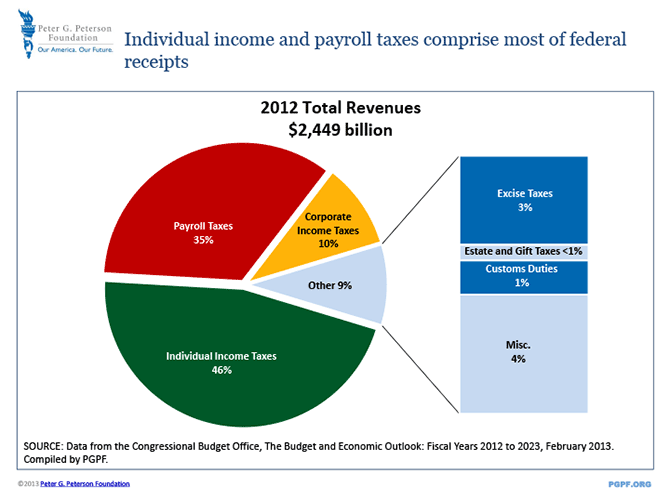
Taxes are collected from many different sectors of the economy. The majority of tax revenue comes from just two sources — the income tax, and the payroll tax — followed by the corporate tax, the excise tax, and estate and gift taxes. Ultimately, however, individuals and families bear the burden of all taxes whatever their source.
Figure 1: Composition of Federal Revenues, 2012

Federal Individual Income Taxes: Individual income taxes are the largest source of tax revenue. Totaling $1.1 trillion in 2012, income taxes constituted about 46 percent of total revenue — or about 7 percent of GDP. Individuals’ tax liabilities vary considerably across the income spectrum. In 2012, the top quintile of earners paid over 80 percent of all income taxes, while the lowest income quintiles, on average, had negative income tax liabilities.
Payroll Taxes: Employers and employees contribute payroll taxes, also known as social insurance taxes. Payroll taxes are the second largest component of federal revenues, accounting for 35 percent of the total in 2012. Payroll taxes help fund Social Security, Medicare, and unemployment insurance. For Social Security, employers and employees each contribute 6.2 percent of every paycheck, up to a maximum amount ($110,100 in 2012). For Medicare, employers and employees each contribute an additional 1.45 percent with no upper limit. The federal unemployment tax, which finances unemployment insurance programs run by the states, is paid only by employers. In 2012, revenue from payroll taxes totaled about $850 billion, or about 5 percent of GDP.
Corporate Income Taxes: The government collects taxes on the profits earned by corporations each year. In 2012, corporate taxes amounted to about $250 billion — that’s about 10 percent of all tax revenues, and just under 2 percent of GDP.
Excise Taxes: Taxes on certain goods such as tobacco, alcohol, and fuel also contribute to federal government revenues. These excise taxes are usually reflected in the higher prices consumers pay for taxed goods. In 2012, revenue from excise taxes totaled $79 billion — roughly half a percent of GDP.
Estate and Gift Taxes: Upon death, wealthy individuals must pay taxes on their estates. Only estates valued over a certain level — $5.12 million in 2012, and adjusted for inflation each year — are taxed at up to a maximum rate of 40 percent. Individuals must also pay taxes on large monetary gifts — those greater than $13,000 in 2012. Total estate and gift taxes for 2012 amounted to $14 billion. Revenue from these taxes accounted for less than one tenth of one percent of GDP.
Tax Expenditures
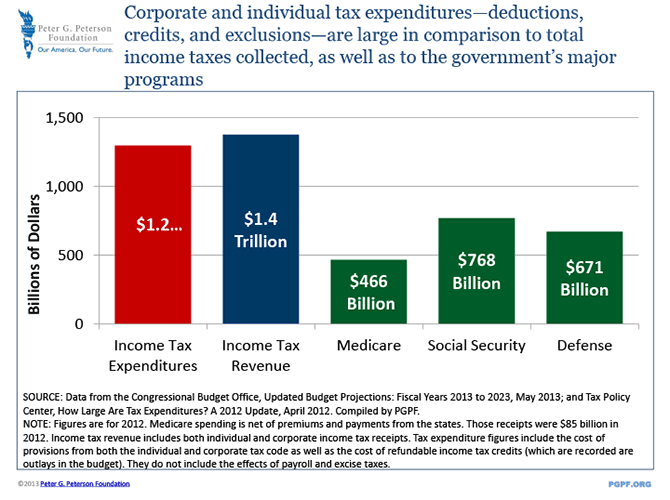
The tax code also contains provisions that allow individual and corporate taxpayers to reduce their tax bills. These special provisions — deductions, deferrals, exclusions, credits, and preferential rates — are collectively called tax expenditures. In 2012, tax expenditures cost about $1.2 trillion — almost the same amount that the federal government actually collected in income taxes, and more than was spent by any single agency or spending program, including the Department of Defense and the Social Security Administration. For individuals, the five largest tax expenditures are popular among taxpayers and amount to over $700 billion — over half of the cost of all expenditures combined!
Five individual tax breaks account for about $700 billion in annual income tax expenditures
|
5 Major Tax Expenditures |
Budgetary Costs (FY 2013) |
|---|---|
| 1. Exclusion of employer contributions for medical insurance and care * | $314 billion |
| 2. Exclusion of pension contributions and earnings ** | $158 billion |
| 3. Deduction of mortgage interest on owner-occupied homes with loan values of up to $1 million | $93 billion |
| 4. Lower rates on dividends and long-term capital gains | $82 billion |
| 5. Deduction for state and local taxes | $64 billion |
| Total | $711 billion |
SOURCE: Data from the Office of Management and Budget, Budget of the United States Government, Fiscal Year 2014, April 2013.
Compiled by PGPF.
* Includes the exclusion from payroll taxes and income taxes.
** Includes employer pension plans, employee and employer contributions to 401k plans, IRAs, and Self-Employed plans.
Tax expenditures work in different ways. Some, known as tax deductions, reduce the amount of income that is taxed. The cost of employer-sponsored health insurance, for example, can be deducted from taxable employee income. Other provisions apply lower, preferential rates to certain types of income, such as capital gains and dividends. A third type of tax expenditure, called a credit, is subtracted from a taxpayer’s total tax liability.
Tax expenditures are often called "spending in disguise" because, like spending programs, the government often uses them to direct resources to specific constituents and priorities. Policymakers use tax expenditures to influence consumer and business behavior. The mortgage-interest deduction, for example, encourages taxpayers to buy homes instead of renting. Similarly, depreciation provisions for businesses encourage new purchases of equipment.
Figure 2: Comparison of Revenues and Expenditures

On the other hand, tax expenditures differ from direct spending programs in an important way that can be quite problematic: Direct appropriations for government programs are evaluated annually as part of the regular budget process, requiring Congress and the President to approve continued funding. Tax expenditures, by contrast, are not subject to the same annual review, making them far less transparent than direct government spending. In addition, because tax expenditures subsidize "favored" activities, they can distort economic decisions in ways that reduce the productivity of our economy. Tax expenditures are typically more valuable for people at higher marginal tax rates, so their benefits often skew toward higher income earners.
Distribution of Tax Burdens
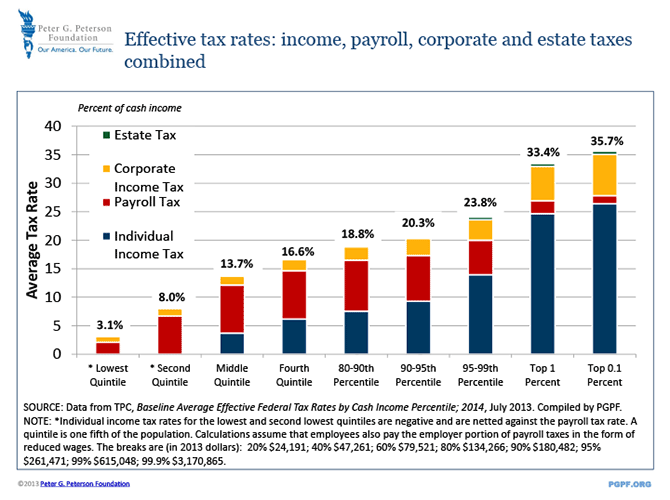
The fairness of our federal tax system — how tax burdens fall on taxpayers across the income spectrum — is one of the most hotly debated issues of our time. Commonly misunderstood is an estimate that about 42 percent of U.S. households did not owe individual income taxes in 2012. Many people mistakenly believe that this statistic implies that almost half of Americans pay no taxes at all. While it is true that some individuals may have no income tax liabilities due to low income levels, deductions and/or exemptions, most of these people still pay other taxes. To assess the equity of tax burdens, it is important to look at all federal taxes combined.
For example, the payroll tax — not the income tax — is the dominant tax for low-income Americans. In fact, on average, the bottom 80 percent of taxpayers pay more in payroll taxes than income taxes. In contrast, individual and corporate income taxes are the largest portion of the effective tax rates for high-income taxpayers. Accounting for all taxes, only an estimated 14.5 percent of American households (mostly the low-income elderly, and very poor families with children) owed neither federal individual nor payroll taxes last year.
Viewed in the aggregate, our tax system is relatively progressive, with higher-income taxpayers paying a larger share of their total income in taxes.
Figure 3: Effective Tax Rates by Income Percentile

Solutions
Our current tax code is overly complex and full of deductions, exclusions, and other special provisions. Moreover, our nation faces growing government debts that could harm our economy unless we can figure out ways to raise more revenue, cut back on spending, or both.
Broadly, there are three main ways that the government could reform the tax system to raise revenue in order to reduce our long-term deficit:
- Raise current tax rates.
- Broaden the tax base by eliminating tax expenditures. This could apply to both the individual and corporate tax codes. Some, including the Bowles-Simpson commission, have recommended broadening the base (or increasing the amount of income that is subject to tax), and using some of the revenue gained to lower marginal tax rates and some to reduce the deficit.
- Introduce a new type of tax to supplement the existing system. Carbon taxes are often highlighted as a way to raise revenue and discourage emissions. Others have proposed progressive consumption taxes to encourage savings.
Given the large number of deductions and benefits contained in the tax code, special interests across the political spectrum make fundamental reform of the system difficult. For an individual taxpayer, the loss of a tax benefit is very noticeable, while the overall gain to the economy is easy to overlook. But, momentum is building for some action on taxes. Ideally, tax reform should aim to reduce the complexity of our tax code, improve economic efficiency, and help raise revenue to address our long-term deficit.
Related:
PGPF: How Much Do People Pay in Federal Taxes?
PGPF: Why Reform Our Corporate Tax Code?
PGPF: The Debate Over Tax Expenditures
Other Resources:
Tax Policy Center
Joint Committee on Taxation
Tax History Museum
Historical Federal Income Tax Rates (Tax Foundation)
