6 Key Charts on Tax Breaks
The United States lost an estimated $1.8 trillion in revenues through tax expenditures in 2023.
https://www.pgpf.org/blog/2024/03/6-key-charts-on-tax-breaks
The search found 256 results in 0.16 seconds.

The United States lost an estimated $1.8 trillion in revenues through tax expenditures in 2023.
https://www.pgpf.org/blog/2024/03/6-key-charts-on-tax-breaks
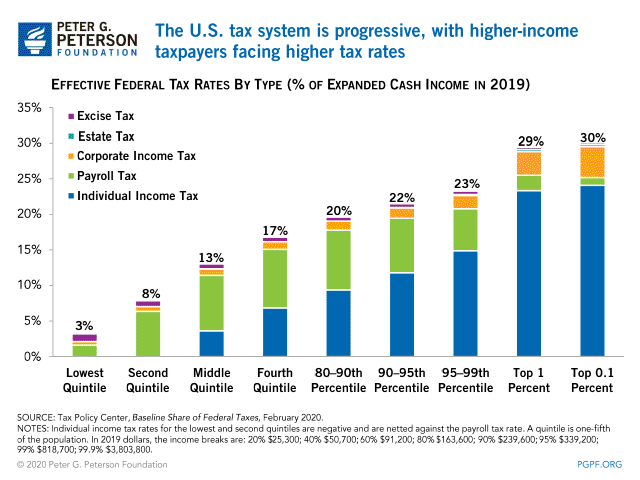
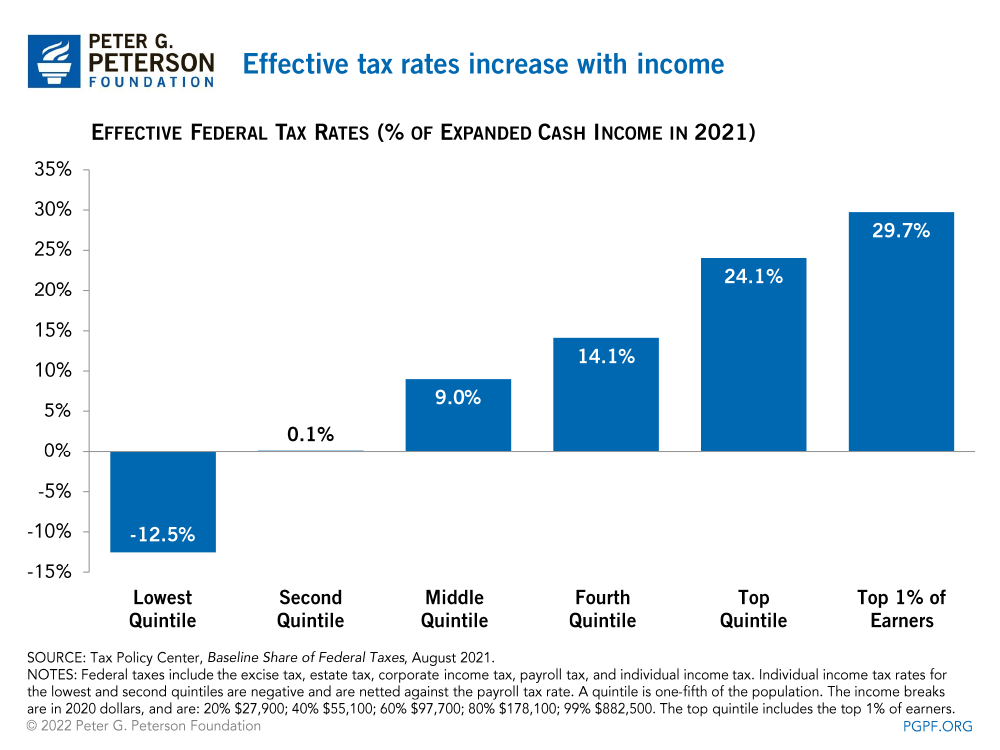
The U.S. tax system is progressive, with higher-income taxpayers facing higher tax rates.
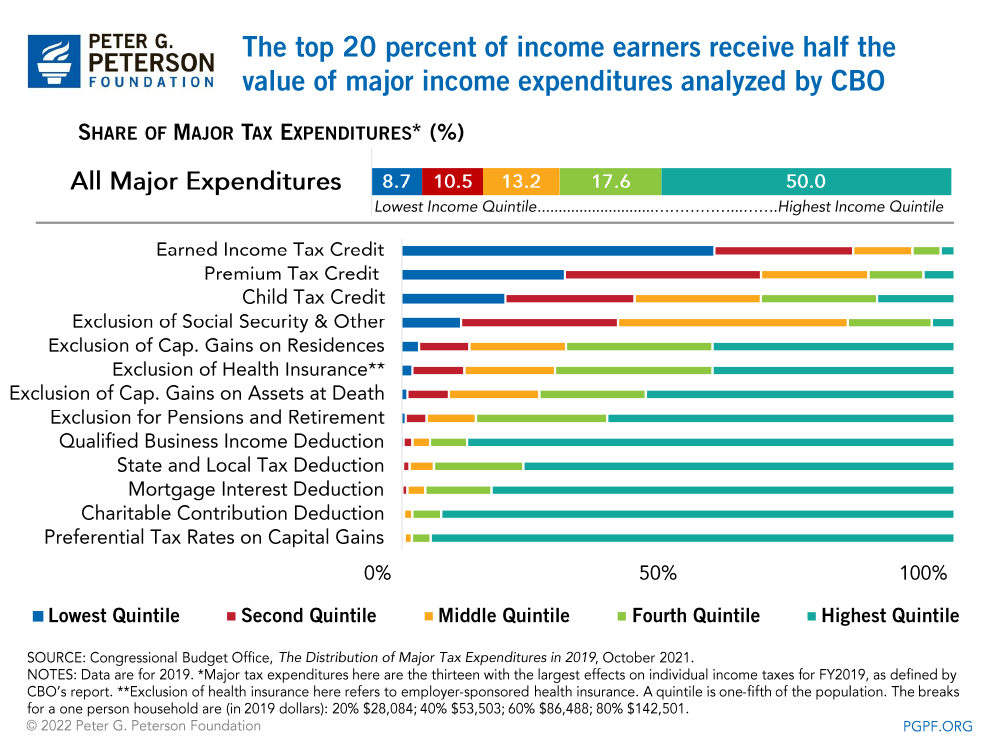
The top 20 percent of income earners receive over half the value of major tax expenditures.
https://www.pgpf.org/Chart-Archive/0199_distribution_tax_expenditures
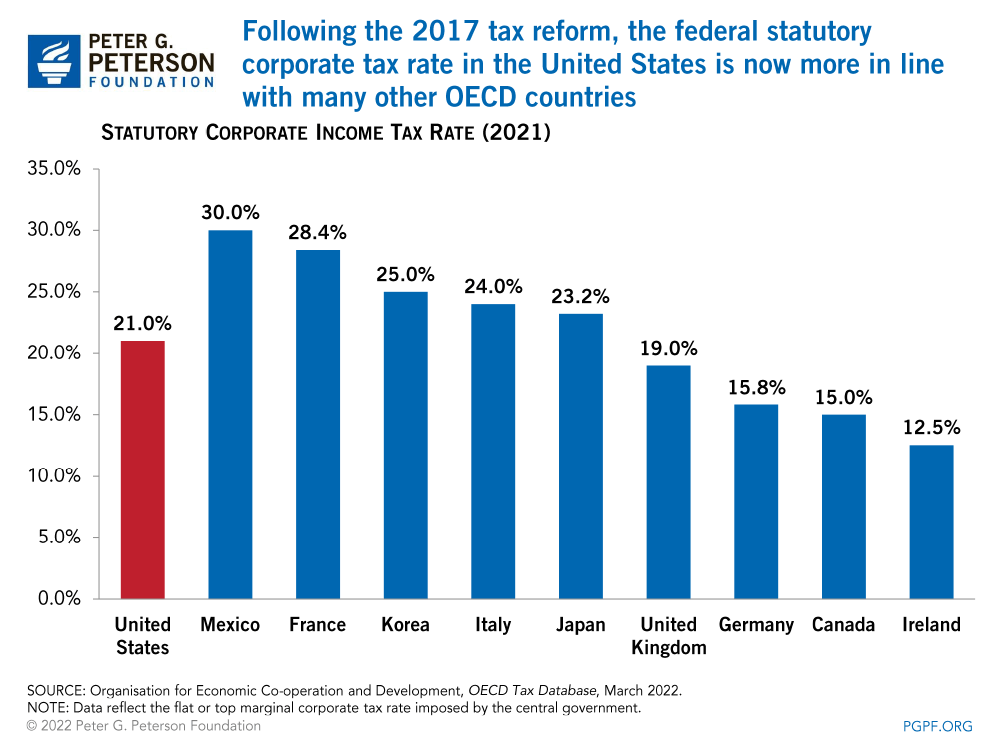
Following the 2017 tax reform, the federal statutory corporate tax rate in the United States is now more in line with many other OECD countries.
https://www.pgpf.org/chart-archive/0273_statutory_corporate_income_tax_rates

The statutory tax rate is the percentage imposed by law. The effective tax rate is the percentage of income actually paid.

The possibility of raising the corporate tax rate has spurred a debate among economists and policymakers about the optimal corporate income tax rate to balance revenue generation and U.S. competitiveness.
https://www.pgpf.org/blog/2021/10/should-the-corporate-income-tax-rate-be-raised
Our most popular charts from 2016 illustrate the nation's fiscal challenges in areas like defense spending, healthcare, and tax reform.
https://www.pgpf.org/blog/2016/12/top-7-fiscal-charts-from-2016
Lawmakers have unveiled a tax overhaul framework, outlining a number of changes to individual and corporate taxes.
https://www.pgpf.org/blog/2017/09/five-charts-to-help-you-better-understand-corporate-tax-reform
Lawmakers unveiled a tax overhaul framework recently, outlining a number of changes to individual and corporate taxes.
https://www.pgpf.org/blog/2017/10/five-charts-to-help-you-better-understand-individual-tax-reform