Charts
Mar 22, 2022
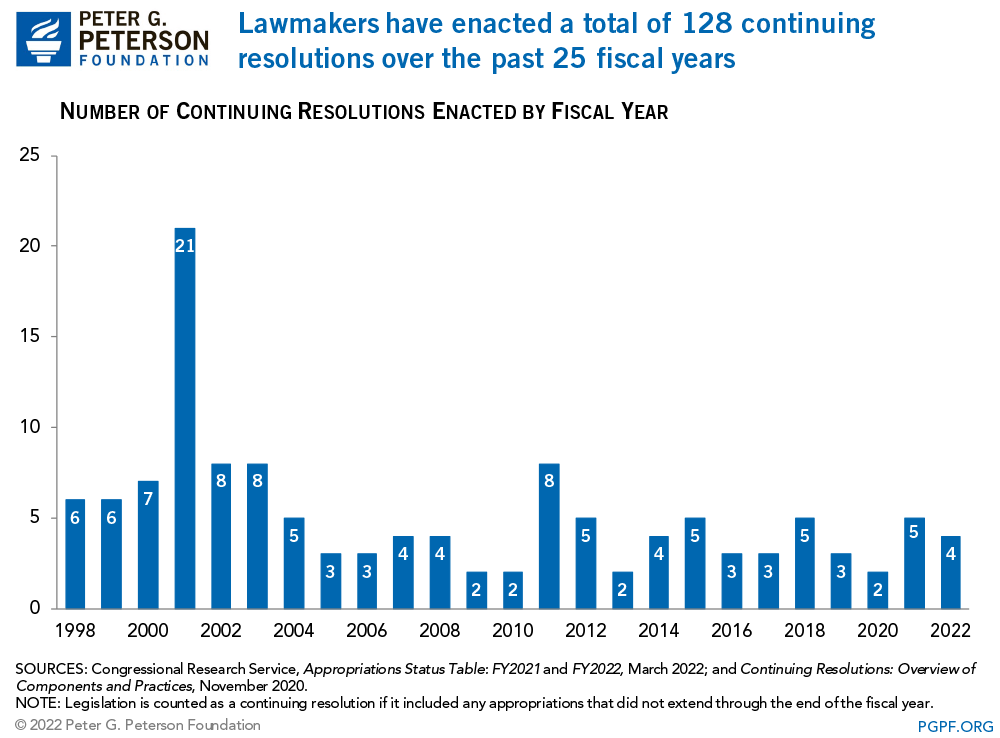
Continuing Resolutions Since 1998
Lawmakers have enacted a total of 128 continuing resolutions over the past 25 fiscal years.
https://www.pgpf.org/chart-archive/0228_continuing_resolutions

The search found 1486 results in 0.229 seconds.
Lawmakers have enacted a total of 128 continuing resolutions over the past 25 fiscal years.
https://www.pgpf.org/chart-archive/0228_continuing_resolutions
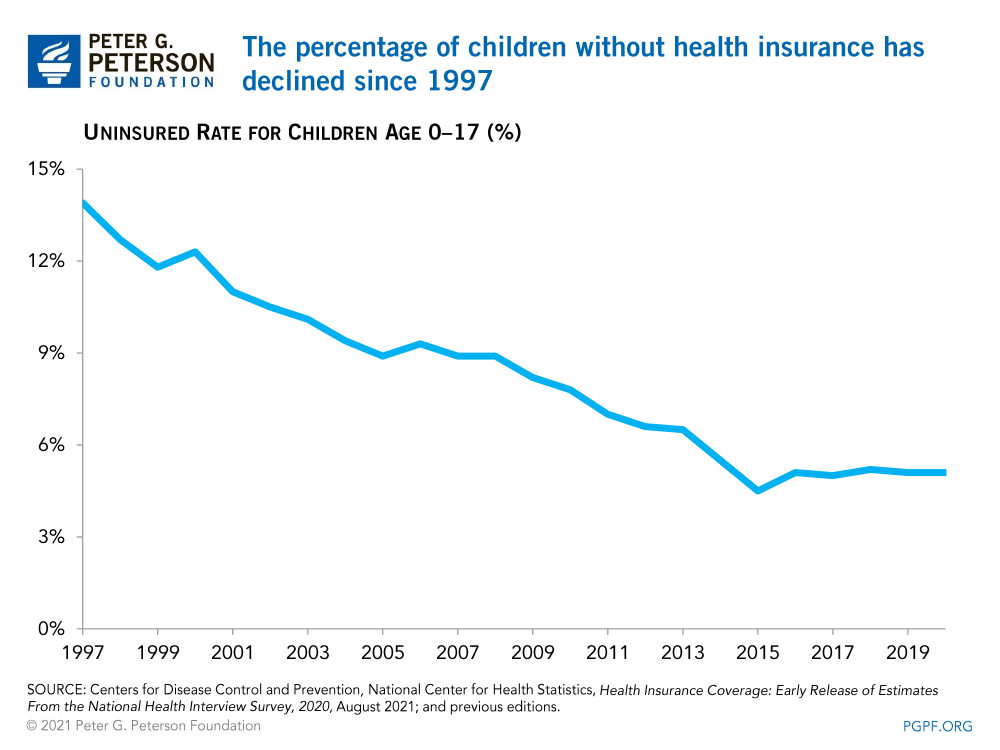
The percentage of children without health insurance has declined since 1997.
“Sadly, we rung in the new year reaching a new record milestone of $34 trillion in national debt,” said Michael A. Peterson.
https://www.pgpf.org/press-release/2023/12/fci-press-release

These charts tell the fiscal story of 2021 — looking back at how our fiscal situation deteriorated over the past year and what challenges lie ahead.
Despite a growing economy and low unemployment, federal budget deficits are projected to grow over the next 10 years.
https://www.pgpf.org/blog/2019/01/five-charts-that-summarize-cbos-budget-and-economic-outlook
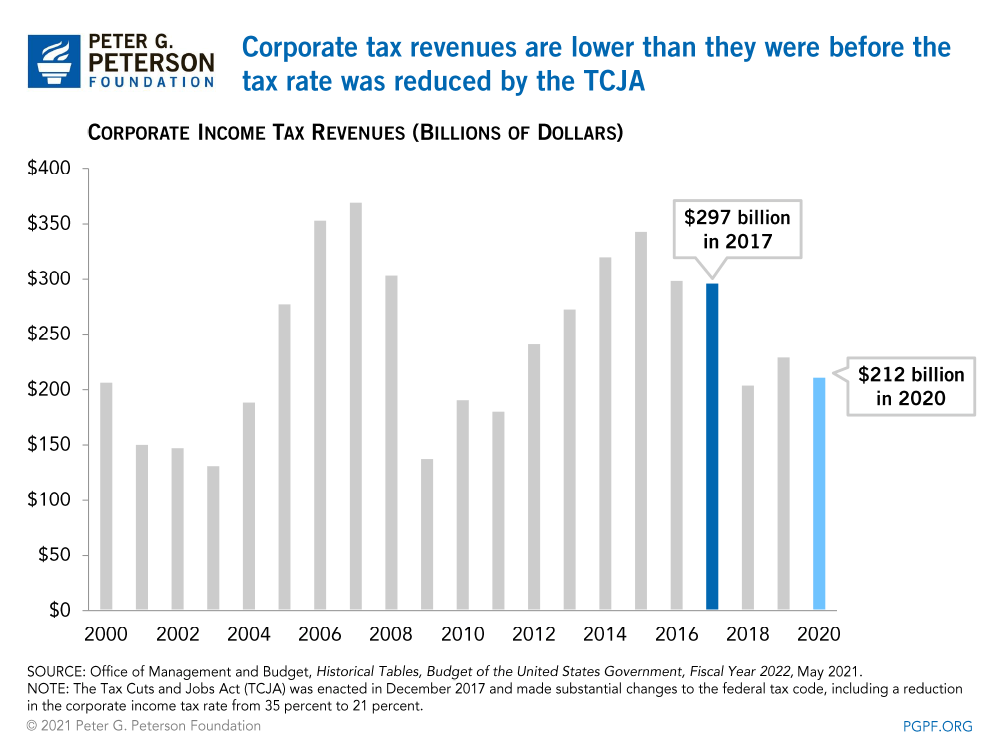
Corporate tax revenues are substantially lower than they were before the tax rate was reduced by the TCJA.
https://www.pgpf.org/chart-archive/0304_corporate_tax_reduced_tcja
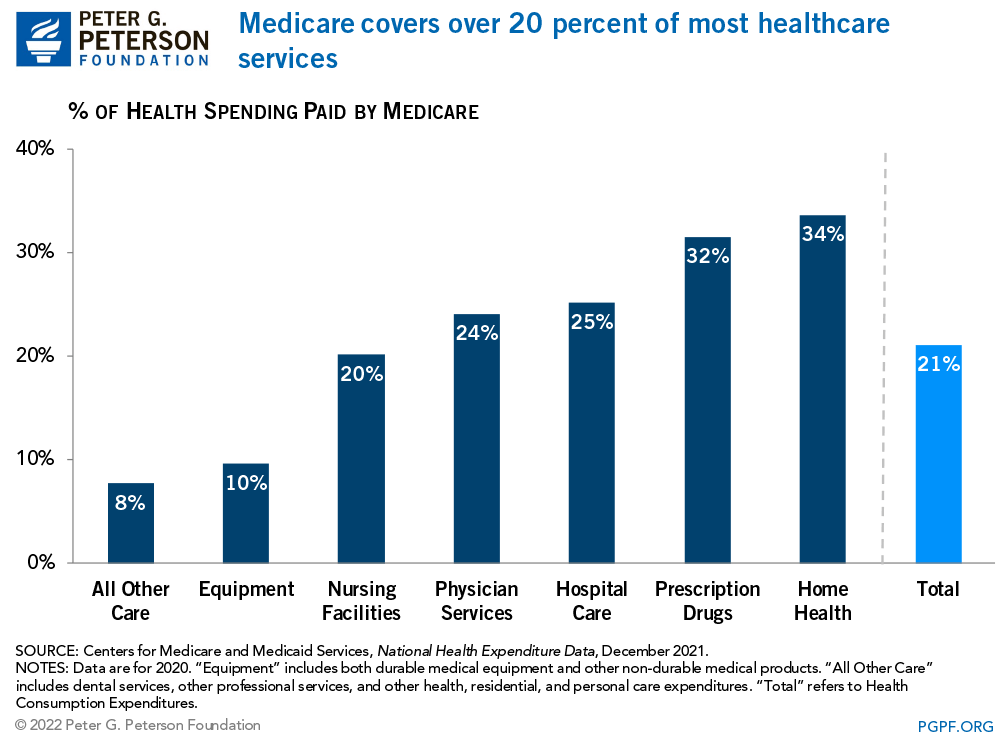
Medicare covers over 20 percent of most healthcare services.
https://www.pgpf.org/chart-archive/0092_medicare_share_costs
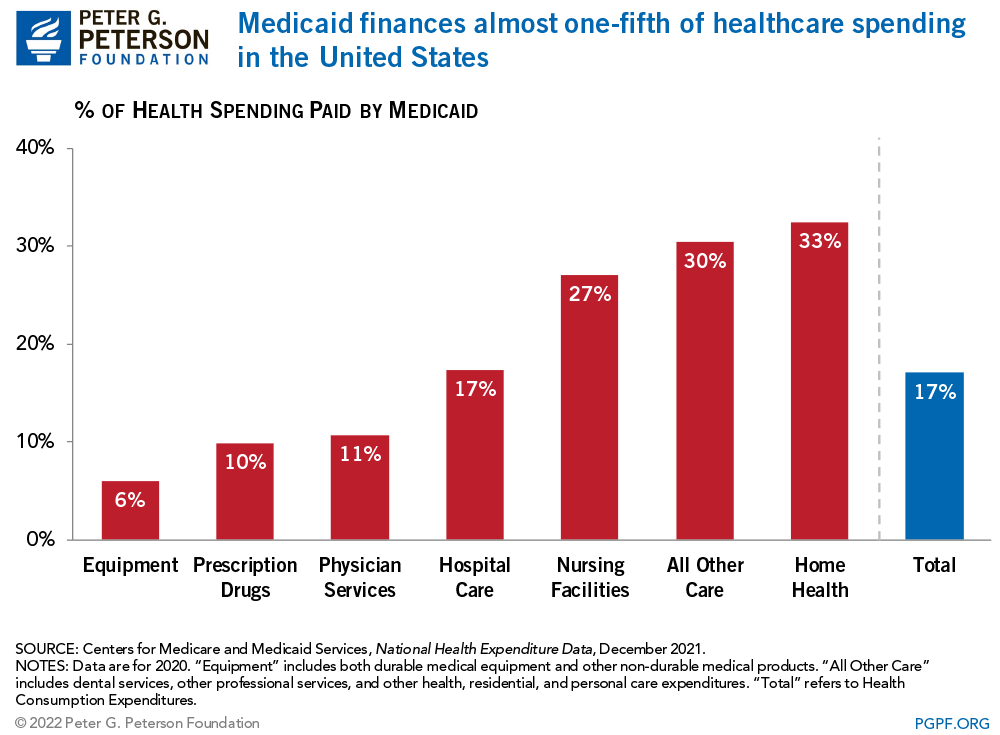
Medicaid finances almost one-fifth of healthcare spending in the United States.
https://www.pgpf.org/chart-archive/0095_medicaid_home_health
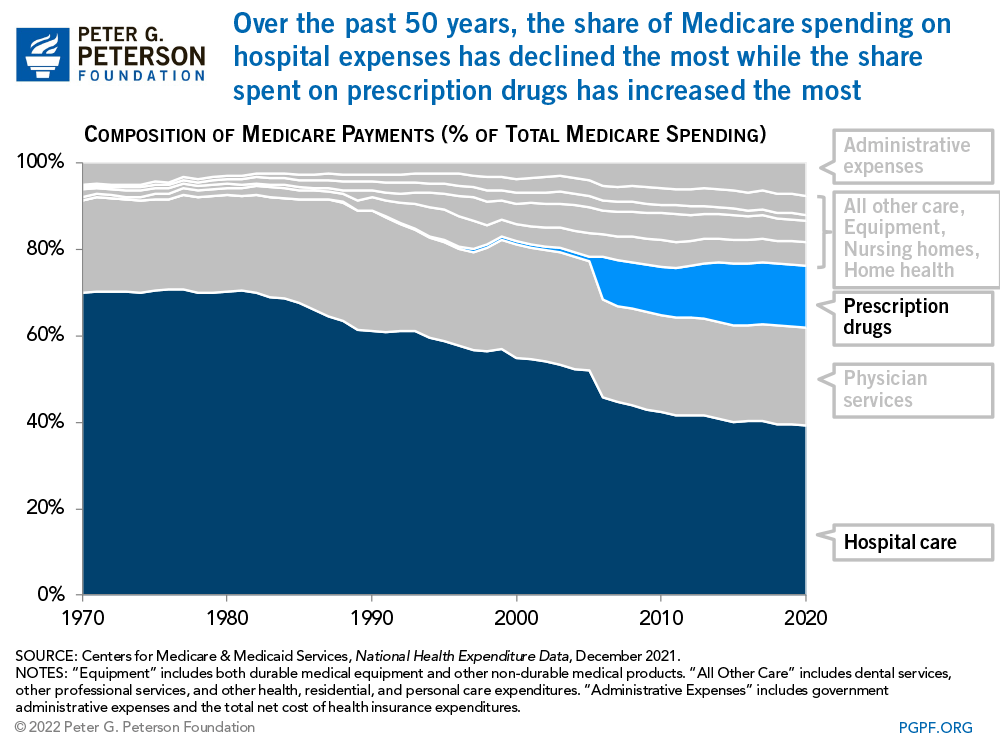
Over the past 50 years, the share of Medicare spending on hospital expenses has declined the most while the share spent on prescription drugs has increased the most
https://www.pgpf.org/chart-archive/0089_composition_medicare_payments