Peter G. Peterson Foundation Second Monthly “Fiscal Confidence Index” Finds Pessimism about Fiscal Progress as Leaders Plan Next Steps on Debt
Peter G. Peterson Foundation Second Monthly “Fiscal Confidence Index” Finds Pessimism about Fiscal Progress as Leaders Plan Next Steps on Debt

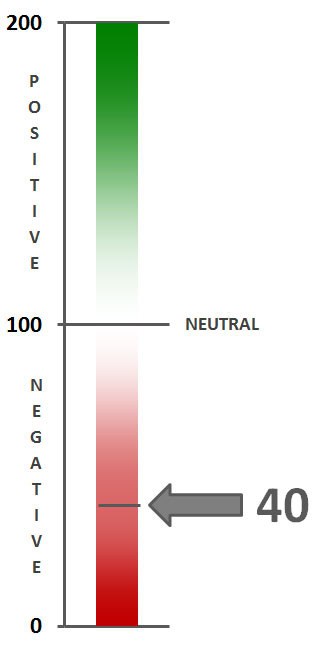
January 2013 Fiscal Confidence Index, Modeled after the Consumer Confidence Index, is 40 (100 is Neutral), Indicating Strongly Negative Public Sentiment — Down from 52 in December
Only 1% of Respondents Say Fiscal Cliff Deal Fixed the Long-Term Debt Problem
91% of Americans Say More Action is Needed
87% of Respondents Want Fiscal Issues to be a Major Topic in State of the Union Address
NEW YORK — Americans are increasingly concerned about the nation’s long-term debt and pessimistic about Washington’s ability to make progress in addressing the debt, according to the Peter G. Peterson Foundation’s latest Fiscal Confidence Index, a monthly measure of public attitudes about the nation’s long-term debt and the efforts elected leaders are making to address the debt.
The January 2013 Fiscal Confidence Index, modeled after the Consumer Confidence Index, is 40 (100 is neutral), indicating strongly negative public sentiment about America’s fiscal situation. Sentiment has declined since December, when the Fiscal Confidence Index was 52.
The Fiscal Confidence Index measures public opinion about the national debt by asking six questions in three key areas:
- CONCERN: Level of concern and views about the direction of the national debt.
- PRIORITY: How high a priority addressing the debt should be for elected leaders.
- EXPECTATIONS: Expectations about whether the debt situation will get better or worse in the next few years.
The survey results from these three areas are weighted equally and averaged to produce the Fiscal Confidence Index value. The Fiscal Confidence Index, like the Consumer Confidence Index, is indexed on a scale of 0 to 200, with a neutral midpoint of 100. A reading above 100 indicates positive sentiment. A reading below 100 indicates negative sentiment.
“The January Fiscal Confidence Index makes clear that Americans remain very concerned about our nation’s fiscal path,” said Michael A. Peterson, President of the Peter G. Peterson Foundation. “The Fiscal Confidence Index shows that Americans are under no illusion that our debt problems are behind us. The fiscal cliff deal did not significantly improve our long-term fiscal outlook, and Americans know that much more must be done to address our fiscal challenges. The increasing pessimism and uncertainty reflected in this survey are not good for the economic recovery. Our economy desperately needs a boost of confidence, and a comprehensive fiscal plan that shows America is on a stable path would do just that.”
Fiscal Confidence Index Key Data Points:
- The January 2013 Fiscal Confidence Index value is 40. A score of 100 is neutral. Values below 100 show negative sentiment, while values above 100 show positive sentiment. (December’s value was 52.)
- The current Fiscal Confidence Index score for CONCERN about the debt is 32, the score for debt as a PRIORITY that leaders must address is 12, and the score for EXPECTATIONS about progress on the debt over the next few years is 75. The Fiscal Confidence Index of 40 is the average of these three sub-category scores. These results indicate strong concern about the debt and very strong feeling that addressing debt should be a high priority, as well as increasing pessimism about the likelihood of leaders making progress on debt issues in the next few years.
- The EXPECTATIONS score in January dropped to 75 from the December score of 96, indicating that the New Year’s fiscal cliff agreement failed to alleviate Americans’ pessimism about the likelihood of progress on debt issues in the next few years.
- For a description of the complete methodology, see the Appendix below.
Fiscal Issues Should Feature Prominently in State of the Union
Following the New Year’s agreement to avert the fiscal cliff, and as the President and a new Congress prepare for upcoming budget deadlines, the Peterson Foundation also polled Americans on their views about the fiscal cliff agreement and their desire for the President to make fiscal issues a priority in his upcoming State of the Union address.
- Only 1% said the fiscal cliff agreement fixed our long-term debt problem. Overall, 91% of respondents said “more” or “a lot more” action is needed on long-term debt. 68% of respondents said the agreement “made very little progress on our long-term debt problem and a lot more needs to be done.”
- 87% of respondents said the next steps on deficit reduction should be a “major topic” in the President’s upcoming State of the Union address.
The Peter G. Peterson Foundation commissioned the poll by the Global Strategy Group to survey public opinion on the national debt. The nationwide poll included 1,007 U.S. registered voters, surveyed by telephone between January 14 and January 17, 2013. The poll has a margin of error of +/- 3.1%. The poll examined voters’ opinions on the national debt, political leadership, and America’s fiscal and economic health.
Detailed poll results can be found online at: www.pgpf.org/what-we-are-doing/education-and-awareness/fiscal-confidence-index
About the Peter G. Peterson Foundation
The Peter G. Peterson Foundation is a nonprofit, nonpartisan organization established by Pete Peterson — businessman, philanthropist, and former U.S. Secretary of Commerce. The Foundation is dedicated to increasing public awareness of the nature and urgency of key long-term fiscal challenges threatening America’s future and to accelerating action on them. To address these challenges successfully, we work to bring Americans together to find and implement sensible, long-term solutions that transcend age, party lines and ideological divides in order to achieve real results. To learn more, please visit www.PGPF.org.
APPENDIX: Fiscal Confidence Index Methodology and Questions
- The Fiscal Confidence Index will be released monthly by the Peter G. Peterson Foundation.
- The Fiscal Confidence Index value is based on six questions in three categories.
- As is done with the Consumer Confidence Index, the first step in calculating the Fiscal Confidence Index is determining the “Relative Value” for each question. This calculation is made by taking the positive response for each question and dividing it by the sum of the positive and negative responses. Each question was asked on a four-point scale, and answers were weighted according to intensity, with the strongest responses counting twice as much as the middle responses (“much” better or worse answers count twice as heavily as “somewhat” better or worse answers).
- The scores for the Concern, Priority, and Expectations categories are determined by averaging the scores derived from the two questions in each category.
- The Fiscal Confidence Index value is converted from the Relative Value to place it on a scale on which 100 indicates equal positive and negative sentiment, while values below 100 indicate negative sentiment and values above 100 indicate positive sentiment.
- The Peter G. Peterson Foundation commissioned a poll by the Global Strategy Group to survey public opinion on the national debt. The nationwide poll included 1,007 U.S. registered voters, surveyed by telephone between January 14 and January 17, 2013. The poll has a margin of error of +/- 3.1%. The poll examined voters’ opinions on the national debt, political leadership, and America’s fiscal and economic health.
- The questions are as follows:
| CONCERN (32) | |||
|---|---|---|---|
| Thinking about our national debt over the last few years, would you say your level of concern has increased or decreased? ◊ Is that a lot or just a little? |
Jan. 2013 | Dec. 2012 | |
| Increased a lot | 60% | 51% | |
| Increased a little | 21% | 25% | |
| Decreased a little | 4% | 7% | |
| Decreased a lot | 2% | 3% | |
| (No change) | 12% | 12% | |
| (Don’t Know/Refused) | 1% | 2% | |
| INCREASED (NET) | 81% | 77% | |
| DECREASED (NET) | 7% | 10% | |
| When it comes to addressing our national debt, would you say things in the United States are heading in the right direction or do you think things are off on the wrong track? ◊ Do you feel that way strongly or just somewhat? |
Jan. 2013 | Dec. 2012 | |
| Right direction-Strongly | 9% | 17% | |
| Right direction-Somewhat | 19% | 23% | |
| Wrong track-Somewhat | 17% | 14% | |
| Wrong track-Strongly | 44% | 36% | |
| (Neither/Mixed) | 7% | 5% | |
| (Don’t Know/Refused) | 5% | 5% | |
| RIGHT DIRECTION (NET) | 28% | 39% | |
| WRONG TRACK (NET) | 60% | 51% | |
| PRIORITY (12) | |||
|---|---|---|---|
| Some people say that addressing the national debt should be among the President and Congress’ top 3 priorities. Do you agree or disagree? ◊ Do you feel that way strongly or just somewhat? |
Jan. 2013 | Dec. 2012 | |
| Strongly agree | 71% | 71% | |
| Somewhat agree | 18% | 18% | |
| Somewhat disagree | 4% | 4% | |
| Strongly disagree | 3% | 4% | |
| (Don’t Know/Refused) | 3% | 4% | |
| AGREE (NET) | 89% | 89% | |
| DISAGREE (NET) | 7% | 7% | |
| And when it comes to our national debt, do you think it is an issue that the President and Congress should spend more time addressing or less time addressing? ◊ Would you say a lot (more or less) time or just a little? |
Jan. 2013 | Dec. 2012 | |
| A lot more time | 68% | 66% | |
| A little more time | 19% | 20% | |
| A little less time | 4% | 5% | |
| A lot less time | 3% | 1% | |
| (The same amount of time) | 3% | 4% | |
| (Don’t Know/Refused) | 3% | 3% | |
| MORE TIME (NET) | 87% | 87% | |
| LESS TIME (NET) | 7% | 7% | |
| EXPECTATIONS (96) | |||
|---|---|---|---|
| And thinking about our national debt over the next few years, do you expect the problem to get better or worse? ◊ Is that much (better or worse) or just somewhat (better or worse)? |
Jan. 2013 | Dec. 2012 | |
| Much better | 9% | 14% | |
| Somewhat better | 21% | 30% | |
| Somewhat worse | 21% | 16% | |
| Much worse | 40% | 31% | |
| (No change) | 4% | 2% | |
| (Don’t know/Refused) | 5% | 6% | |
| BETTER (NET) | 31% | 44% | |
| WORSE (NET) | 61% | 47% | |
| And when it comes to our national debt, are you optimistic or pessimistic that the United States will be able to make progress on our national debt over the next few years? ◊ Would you say you are very (optimistic or pessimistic) or just somewhat? |
Jan. 2013 | Dec. 2012 | |
| Very optimistic | 19% | 23% | |
| Somewhat optimistic | 29% | 32% | |
| Somewhat pessimistic | 18% | 13% | |
| Very pessimistic | 30% | 26% | |
| (Neither/Mixed) | 3% | 2% | |
| (Don’t Know/Refused) | 2% | 3% | |
| OPTIMISTIC (NET) | 48% | 55% | |
| PESSIMISTIC (NET) | 47% | 40% | |
Further Reading

Lawmakers are Running Out of Time to Fix Social Security
Without reform, the combined Social Security trust funds will be depleted in 2035.
Budget Basics: Tax Expenditures
Tax expenditures can come in the form of exclusions, exemptions, deductions, and credits.

The U.S. Forgoes Hundreds of Billions of Dollars Each Year Due to Unpaid Taxes
Cracking down on the tax gap would not only introduce more fairness into the system, but it could be a big help for our nation’s fiscal imbalance.