13 Charts That Show the Stunning Impact of 2020 on Our Fiscal and Economic Outlook
Last Updated December 10, 2020
America’s fiscal situation has significantly deteriorated over the past year. Primarily because of the coronavirus (COVID-19) pandemic and the government’s necessary response to help mitigate its impact, the deficit in fiscal year 2020 was the largest in U.S. history. But while COVID-19 was mainly responsible for the decrease in economic output and most of the growth in last year’s deficit, the national debt was already on an unsustainable path due to the aging of the population, rapidly rising healthcare costs, mounting interest payments, and insufficient revenues to meet commitments that have been made.
The 13 charts below tell the fiscal story of 2020, illustrating how the pandemic compounded existing challenges and worsened the nation’s fiscal outlook.
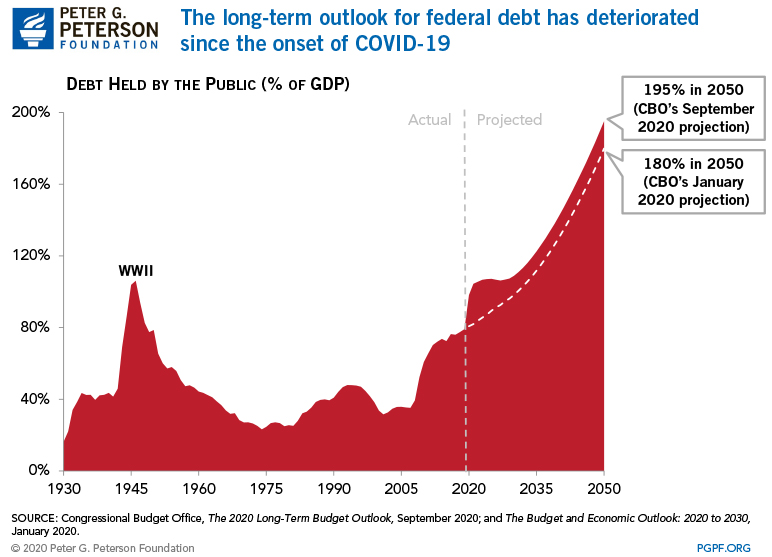
1. The federal debt grew significantly faster in 2020 than previously expected. The federal debt was already on an upward trajectory prior to 2020, but it grew much faster than expected over the past fiscal year. While debt held by the public was previously projected to reach 98 percent of GDP by 2030, that level was reached a few months ago — 10 years earlier than anticipated. By 2050, debt is expected to grow to nearly twice the size of the economy.
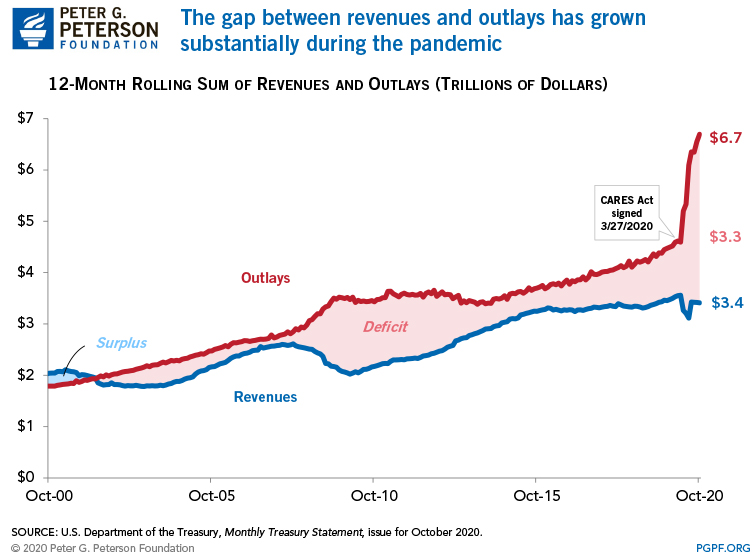
2. The coronavirus pandemic is mainly responsible for exacerbating the nation’s fiscal trajectory.
In response to the economic downturn caused by the pandemic, the federal government enacted and expanded many programs to provide fiscal support to Americans. As a result, spending rose dramatically, while revenues took a dip.
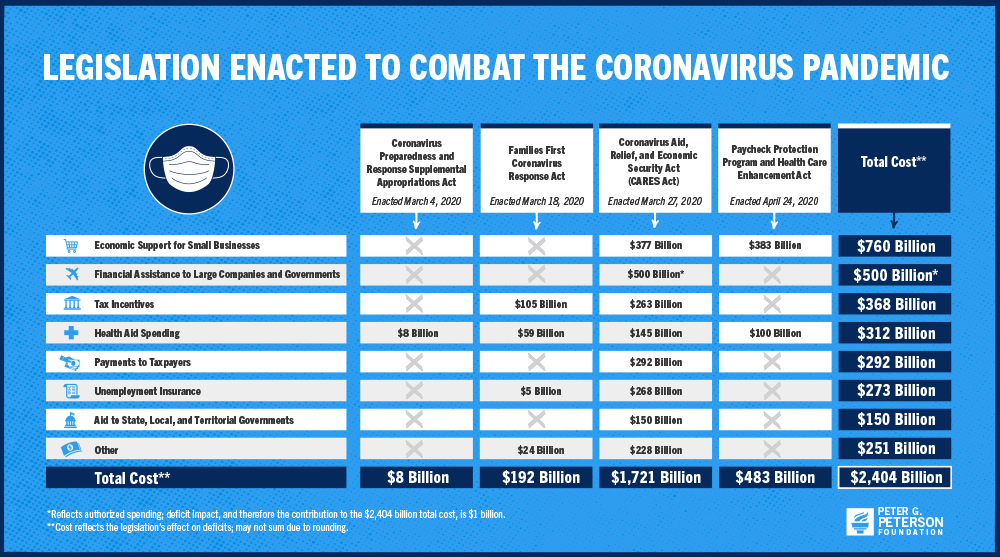
3. Various programs were enacted to provide economic relief to Americans during the pandemic. Lawmakers passed programs expected to cost more than $2 trillion in 2020, providing assistance to individuals, small businesses, healthcare providers, and local governments.
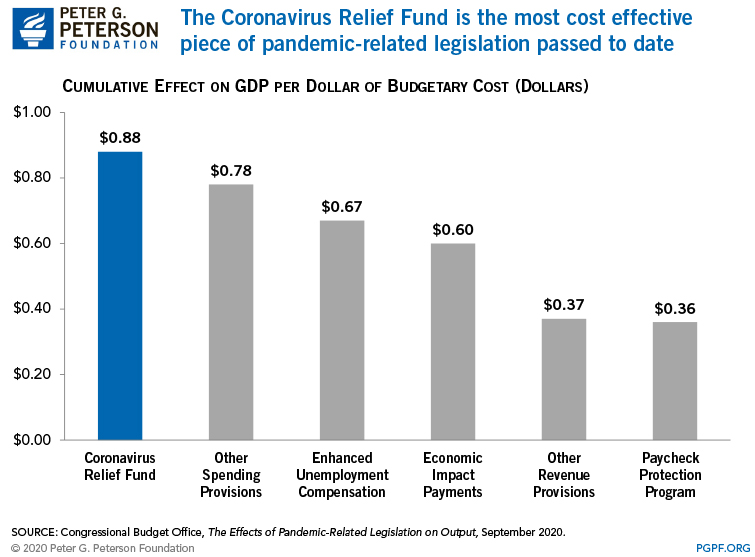
4. Programs enacted in response to the pandemic had varying levels of effectiveness in boosting the economy. Taken as a whole, the government’s response to the pandemic has helped mitigate its economic effects. But some of the provisions provide more “bang for the buck” than others. Moreover, as many of those programs are set to expire at the end of the year, analysts believe that additional support may be needed.
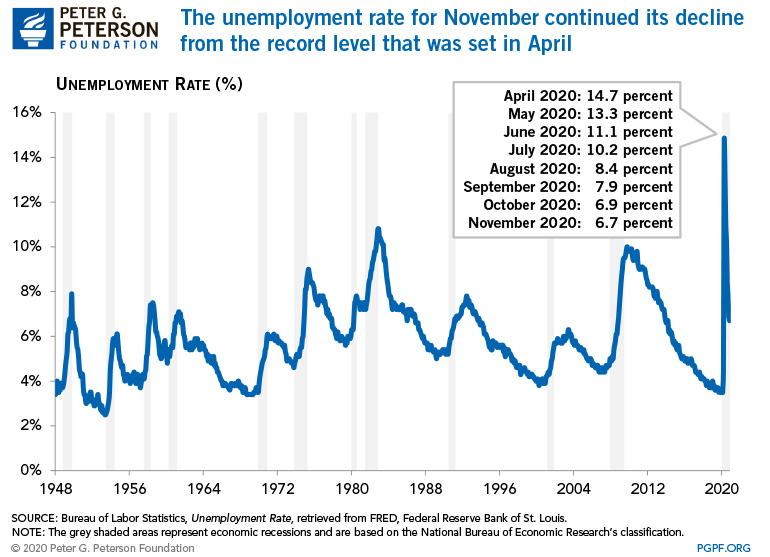
5. Unemployment rose to a record high due to the economic downturn caused by COVID-19. As businesses were closed and individuals were asked to stay home to prevent the spread of the virus, the unemployment rate spiked from 4.4 percent in March to 14.7 percent in April — which was a new post-WWII high. The unemployment rate has steadily dropped since but remains significantly higher than before the pandemic.
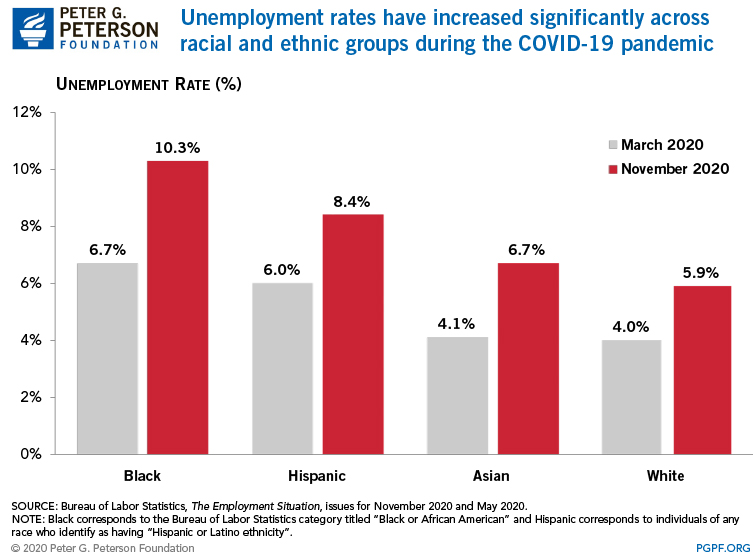
6. The effects of the economic downturn were not equally felt among different racial and income groups. While labor market conditions weakened for all groups of people since the pandemic began, non-white workers experienced higher increases in unemployment. Furthermore, research has shown that lower-income individuals did not receive a proportional amount of assistance from certain federal programs during the pandemic — exacerbating persistent structural inequalities in our economy and society.
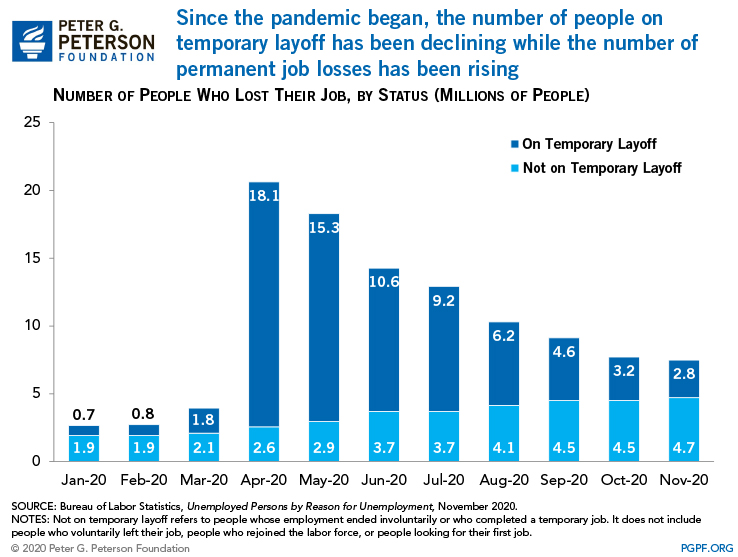
7. Some of the economic damage done by the pandemic may linger for a while. After reaching its peak April, the unemployment rate has been on the decline. However, that doesn’t tell the full story; while temporary layoffs have been decreasing, permanent layoffs have more than doubled since the pandemic began — which many experts point to as a sign of a longer-term damage.
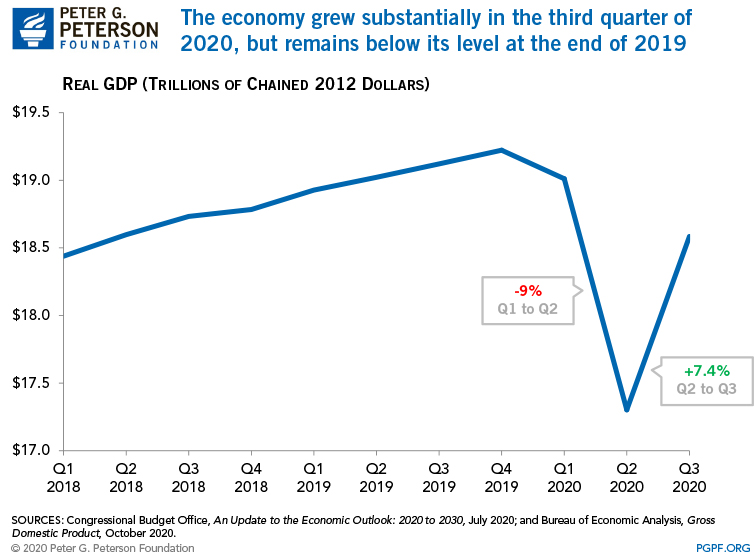
8. The economy has yet to fully recover from the pandemic. Due to the pandemic, the economy contracted by 9 percent in the second quarter of 2020, the largest quarterly decline on record. While GDP grew substantially in the third quarter, it still remains below pre-pandemic levels.
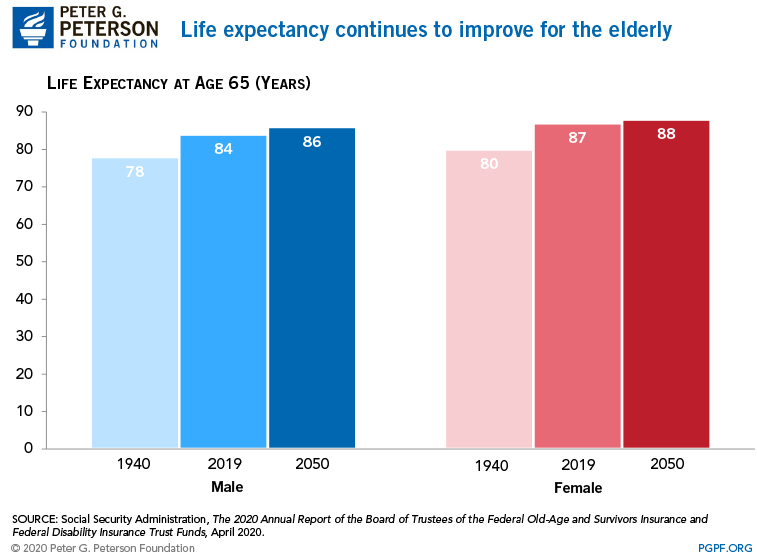
9. The American population is aging rapidly and living longer, and those trends continue to put pressure on the federal budget. While increased longevity is good news and the retirement of the baby boomers is no surprise, such trends mean that the federal government will spend more on programs that serve older Americans. Social Security and Medicare were already facing budget shortfalls before the pandemic, and the recession caused by the public health crisis will only amplify the financial difficulties facing those programs.
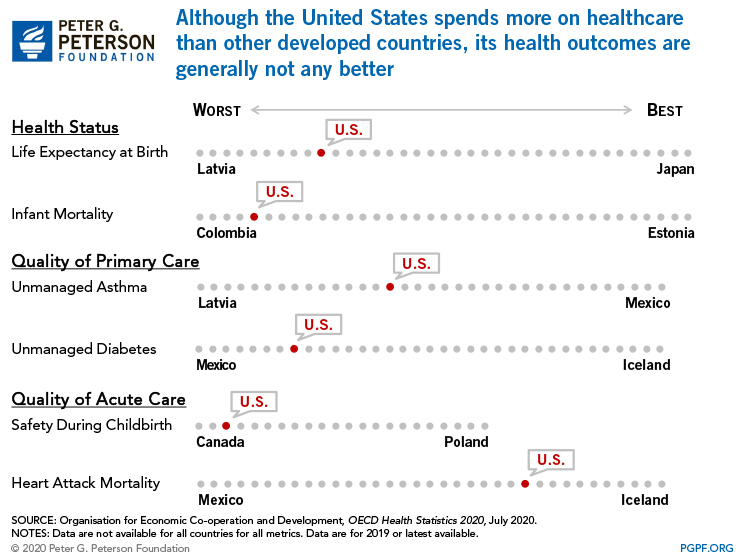
10. The American healthcare system, which has been strained due to the pandemic, was already riddled with inefficiencies. COVID-19 has highlighted the importance of having a strong public health system. America’s system is significantly costlier than those in other advanced economies, and healthcare represents a large and growing part of the federal budget. However, our system does not always provide better health outcomes.
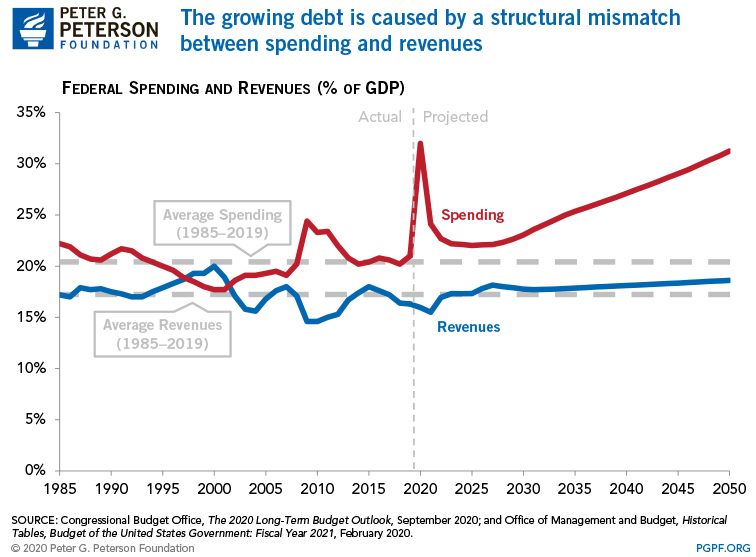
11. Spending is expected to continue outpacing revenues even after the programs enacted in response to the pandemic wane. Spending is projected to fall from 32 percent of GDP in 2020 to 24 percent of GDP in 2021, according to the Congressional Budget Office (CBO). However, underlying trends such as the aging population, rising healthcare costs, and growing interest payments will continue to fuel the projected increase in spending in the future. Revenues are also expected to grow but will not keep pace with spending.
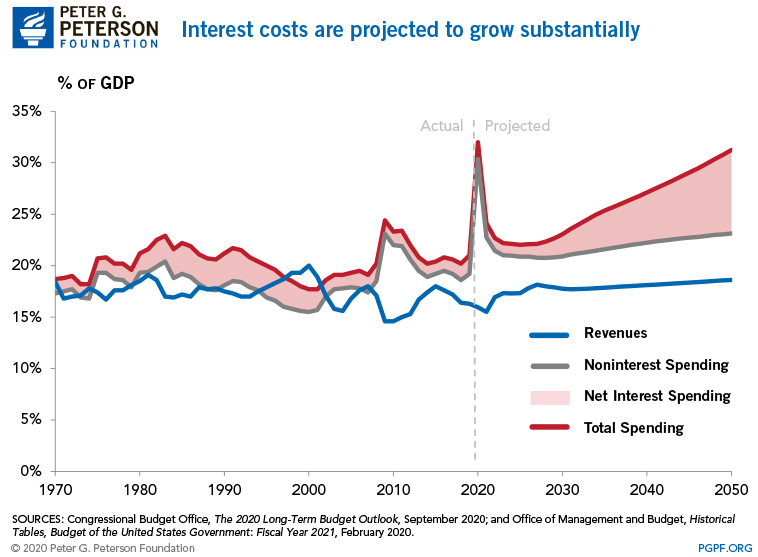
12. Interest paid on the national debt dropped in 2020 but is expected to resume its growth over the next few years. Interest rates have dropped partly due to the Federal Reserve’s efforts to provide economic relief. As a result, interest costs in 2020 were lower than they were in the previous year (despite an additional $3 trillion in debt). However, interest costs are expected to grow rapidly in the longer term and ultimately outpace the growth in non-interest spending.
13. Deficits will fall after 2020 but will remain high over the next decade.
While deficits are projected to decline as pandemic-related spending decreases and the economy improves, the structural mismatch between spending and revenues will continue to lead to large deficits in the future. In fact, CBO has projected trillion-dollar plus deficits for every year through 2030.
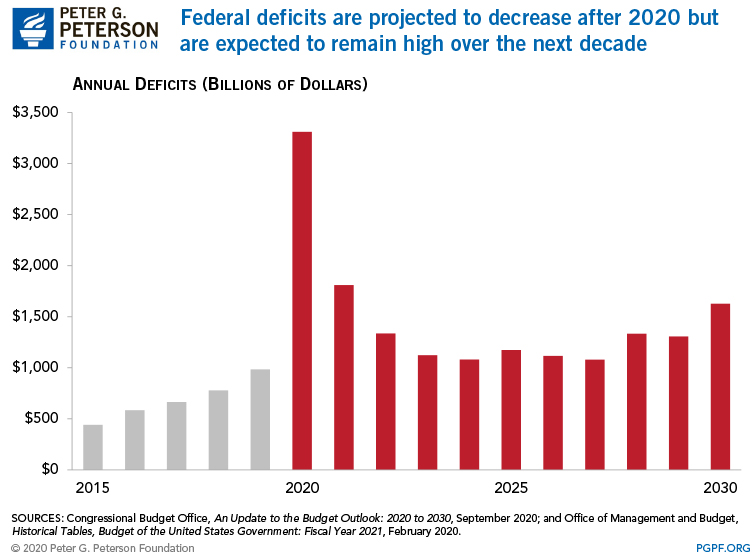
Image credit: Photo by Andriy Onufriyenko/Getty Images
Further Reading
Long-Term Budget Outlook Leaves No Room for Costly Legislation
As lawmakers consider costly legislation to extend expiring tax provisions this year, CBO’s latest projections serve as a warning that our fiscal outlook is already dangerously unsustainable.
Moody’s Warns Recent Policy Decisions Worsen U.S. Fiscal State, Maintains Negative Outlook Rating
Moody’s says that the United States is in fiscal deterioration, warning that government policy decisions in the near term could contribute to higher interest rates and worsening national debt.
National Debt Would Skyrocket Under TCJA Extension
New analysis released from the nonpartisan CBO shows deficits doubling and debt skyrocketing under a scenario where the expiring provisions of the Tax Cuts and Jobs Act were made permanent.
