What Are the Trends Slowing Wage Growth and Fueling Income Inequality?
Last Updated July 30, 2019
Over the past year, our labor market has seen relatively strong gains in wage growth — and that’s good news. However, wage trends over a longer historical period offer insights on why many Americans are still feeling left behind.
This blog presents key wage trends over the past four decades, outlining slow wage growth over the last four decades, how different income groups have been affected, and the resultant rise in inequality. Finally, we examine possible reasons for these trends and what policymakers could consider in the future.
Trends Over the Past Four Decades
Longer-Term Historical Wage Growth Has Been Weak
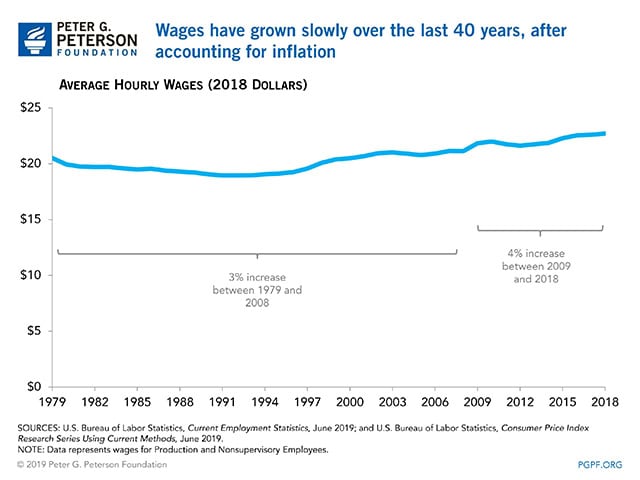
While there has been positive news about recent wage growth, looking back over the last 40 years reveals a different story for the average worker. Adjusting for inflation, wages (as measured by average hourly earnings reported monthly by the Bureau of Labor Statistics) were only around 11 percent higher in 2018 than they were in 1979. In fact, during the 1980s and early 1990s, inflation-adjusted wages actually decreased, and didn’t reach their 1979 level again until 2001. Since the end of the most recent recession in 2009, wages (adjusted for inflation) have grown by a total of 4 percent.
Wages Have Grown Faster for Those with Higher Incomes
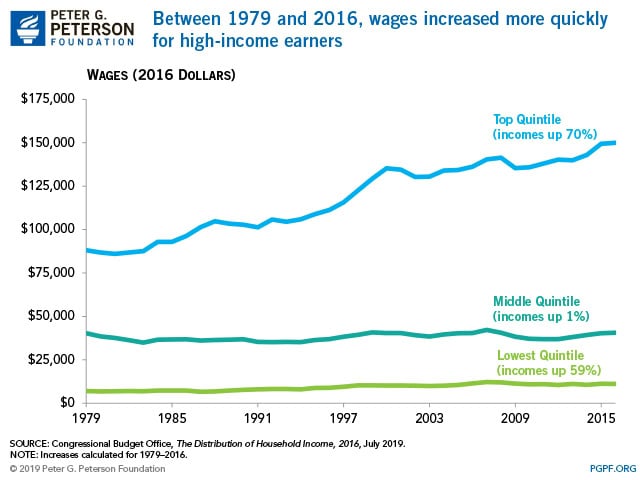
Over the past several decades, wages have grown faster for those with higher incomes. In a 2019 report on the distribution of household income, the Congressional Budget Office (CBO) found that between 1979 and 2016 cumulative growth in average wages was 70 percent for the top one-fifth of earners compared to 59 percent for the lowest one-fifth.
Inequality Has Increased
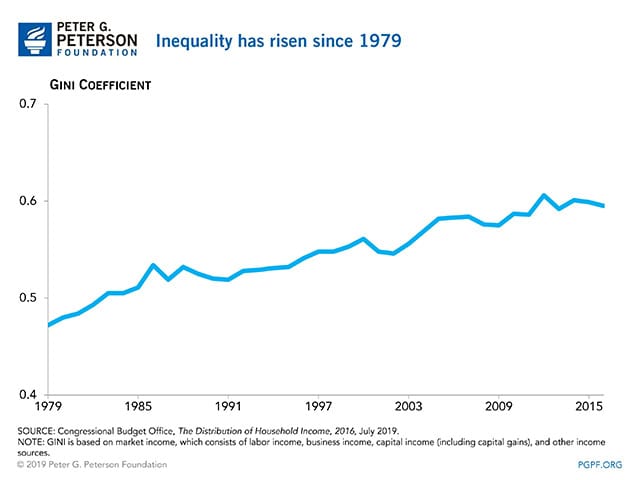
Not surprisingly, this disparity in growth rates has resulted in incomes that are more unequal today than they were in 1979. One way to quantify income inequality is the Gini coefficient, which ranges from 0 to 1, where 0 represents perfect equality and 1 represents perfect inequality. Between 1979 and 2016, the Gini coefficient for the United States increased from 0.412 to 0.513, according to CBO.
Why Has Wage Growth Been Relatively Stagnant for So Many Workers?
Wage growth is a key component to increasing our standard of living. But as shown above, over the long term, wage growth for many workers has been lackluster. Why? Wage trends reflect a confluence of several deep-rooted forces, although some debate exists about the relative importance of each. Among the more notable factors are:
Slow Labor Productivity Growth
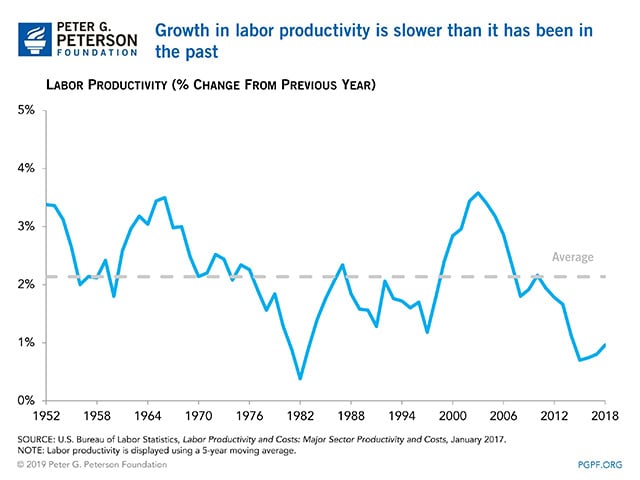
Growth in productivity has been sluggish, except for a burst in the late 1990s and early 2000s as a result of the IT revolution. In fact, productivity growth between 2013 and 2018 averaged just 0.9 percent per year. In comparison, between 1948 and the mid-1990s, labor productivity growth averaged 2.2 percent annually. Labor productivity, measured as output per hour of labor, is a key factor in wage growth and the rise in living standards. As labor productivity increases, workers are able to produce more for each hour worked, and therefore should expect to see their wages increase.
Why productivity growth has been languishing, and whether it will continue to do so, is a matter of some debate. It used to be the case that the increasing skills of the U.S. workforce contributed positively to productivity growth. However, now, it seems that a slowdown in investment and the role of technology (and the lag in its uptake) have put a drag on productivity growth.
It should be noted that prior to the 1970s, worker compensation (wages plus benefits) grew in tandem with labor productivity. Since that time, however, there has been a divergence in wage and productivity growth, as the rate of growth in productivity outpaced wage growth.This divergence speaks to the fact that while labor productivity growth is important for wage growth, it is not the only factor that affects it.
Lower Worker Bargaining Power
Some research indicates that changes to the power dynamic between workers and employers may affect wage growth. Recent studies have found that wages are lower in markets where employers are more concentrated. When relatively few firms dominate the labor market, they gain more bargaining power over workers, which leads to decreased wages. Evidence suggests that this relationship is exacerbated when unionization rates are lower, and unionization — particularly in the private sector — has been decreasing for decades.
The Economy Is Less Dynamic, and Workers Are Moving Less Often
The American economy is becoming less dynamic. Economic dynamism is a broad term that covers many metrics that contribute to a growing economy, including geographic mobility, job turnover rates, new business creation, and the share of people employed by new companies. Yet in all of these metrics, the country is performing less well than it once did. This has implications for productivity growth and therefore impacts wage growth.
Part of what makes the economy less dynamic is that American workers are less likely to move today than they were 30 years ago. Since 1990, the percentage of people who move from one state to another in a given year has declined by half, from 3.8 percent in 1990 to less than 2.0 percent in 2016. If workers have more job options, they are better able to negotiate (and renegotiate) their salary. Thus, lower geographic mobility — which results in less job choice — reduces the ability of workers to negotiate better wages and might suppress wage growth.
Higher Benefit Costs
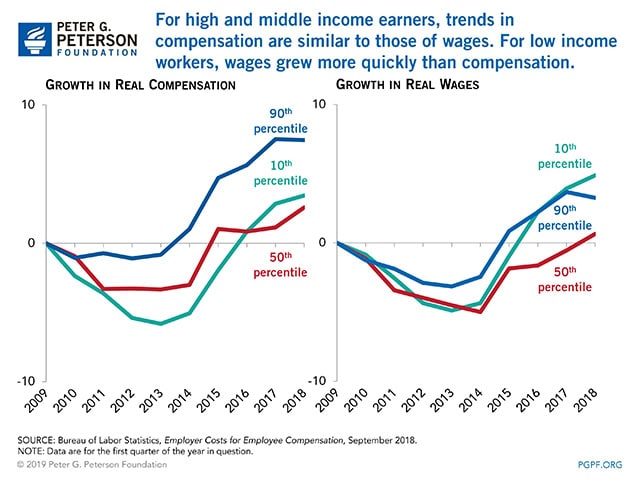
Wages are not the only form of worker compensation, and some economists argue that total compensation — including non-wage benefits such as health insurance and paid time off — is a more accurate measure of economic well-being than wages. The average worker receives 33 percent of their total compensation in the form of non-wage benefits; by comparison, in 2004, this number was 29.
Total compensation may well be a more accurate measure of worker well-being, because the metric provides a more comprehensive picture of both the salary and benefits received by a worker. However, using this metric doesn’t necessarily improve the narrative regarding worker well-being, though it does provide more nuance than the wage growth metric. For example, by both metrics, those who are in the middle of the income distribution are about where they were in 2009. According to the Bureau of Labor Statistics, between 2009 and 2018, wages for middle income earners grew by less than 1 percentage point. Total compensation for this group grew by 2.6 percentage points over the same period. Conversely, both high income and low income workers have fared better during the same period. For both of those groups, wages grew by between 3 and 5 percentage points. The nuance provided by the total compensation comes into play here — by this metric, growth at the high end of the distribution was double that of the low end.
Slack in the Labor Market
While historical low wage growth over the long term cannot be attributed to labor supply and demand, it may be a factor for shorter-term trends. As unemployment decreases, wages would be expected to increase to attract workers. But we are now at levels of near-record unemployment lows, and stronger wage growth has only recently materialized. Slack in the labor market — which broadly refers to underutilization of the labor force (for example those who work part time, but would prefer to work full time) — might be the reason. There are a number of ways to measure “slack,” including involuntary part-time employment, temporary contracts, and the short term unemployment rate, but some economists believe that wages aren’t increasing more quickly because more people are available to work than indicated by the statistics.
Conclusion
One of the more sobering economic trends over the past several decades has been the persistent weak wage growth for many workers, especially those in the middle of the income scale. While the wage gains witnessed over the past year or so have been good news, it remains to be seen whether recent gains will be sustained, and how long the economy can continue its already very long expansion.
Image credit: Photo by kali9/Getty Images
Further Reading
National Debt Puts Upward Pressure on Inflation and Interest Rates
America’s unsustainable fiscal outlook can have “significant consequences for price stability, interest rates, and overall economic performance,” according to a new report.
Why Is the Federal Deficit High If Unemployment Is Low?
The U.S. is experiencing an unusual and concerning phenomenon — the annual deficit is high even though the unemployment rate is low.
What Is Inflation and Why Does It Matter?
Here’s an overview of inflation, why it matters, and how it’s managed.


