Lawmakers unveiled a tax overhaul framework recently, outlining a number of changes to individual and corporate taxes. To help clarify aspects of our current tax system, below are charts that focus specifically on individual taxes and will help provide some context for the tax reform debate.
See here for charts focused on corporate taxes.
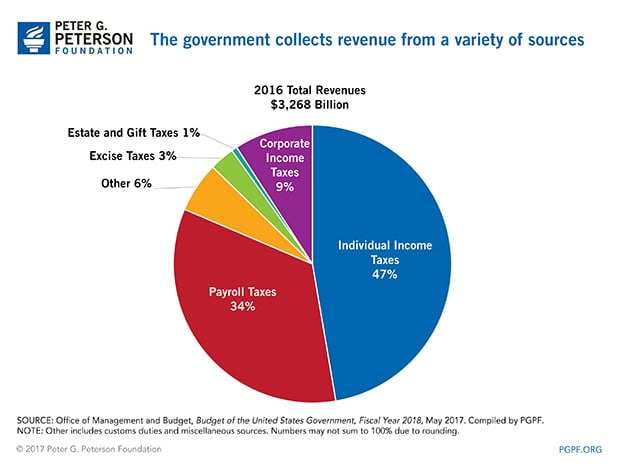
1. In 2016, the federal government collected $3.3 trillion in revenue from a variety of sources. The largest source of revenue was individual income taxes which accounted for $1.5 trillion (or 47 percent) of the total.
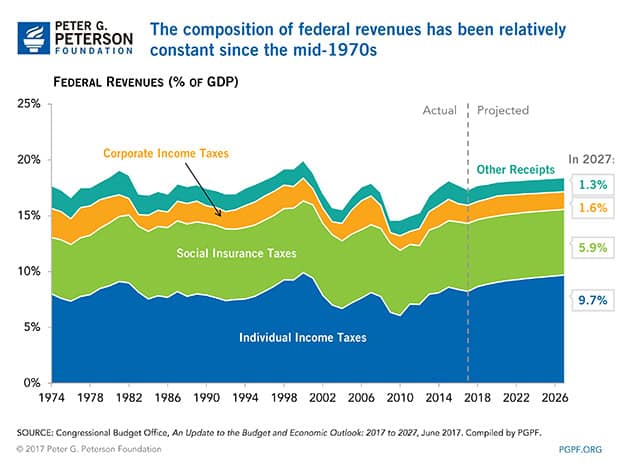
2. Historically, individual income tax revenue has averaged about 8 percent of gross domestic product (GDP), with notable decreases during the recessions in the early 2000s and in 2008. Such revenues totaled 8.4 percent of GDP in 2016; the Congressional Budget Office (CBO) projects that absent changes to the current system, individual income tax revenue will climb over the next decade, reaching 9.7 percent of GDP in 2027.
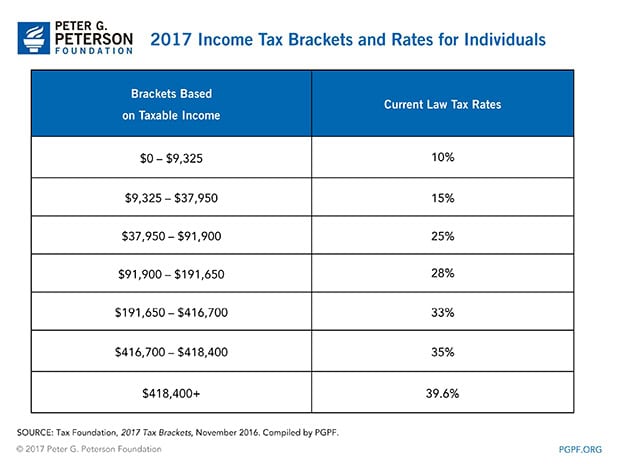
3. Currently, there are seven tax brackets. For individual taxpayers, the lowest bracket, which applies to taxable income up to $9,325, is 10 percent. The highest bracket is 39.6 percent and applies to those whose taxable income is greater than $418,400. Different tax brackets apply to married couples and individuals classified as head of household.
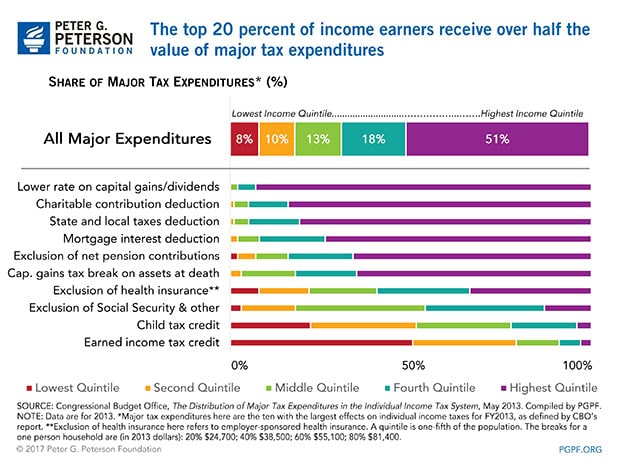
4. However, the tax code currently includes more than 150 tax expenditures, which provide exemptions, deductions, credits, and preferential rates to select groups of taxpayers. In 2016, those tax breaks exceeded $1.5 trillion. Six of the most popular breaks — including the exclusion of employer contributions for health insurance and the deduction of mortgage interest — account for more than half of the annual cost of tax expenditures. And most of those tax expenditures disproportionately benefit higher-income filers; the highest income quintile (the top 20 percent) receive more than half of the value of those provisions.
5. Overall, the US tax system is progressive with higher-income taxpayers facing higher tax rates. In particular, lower-income households pay very little individual income taxes, whereas the highest earners pay a larger share of their income to such taxes.
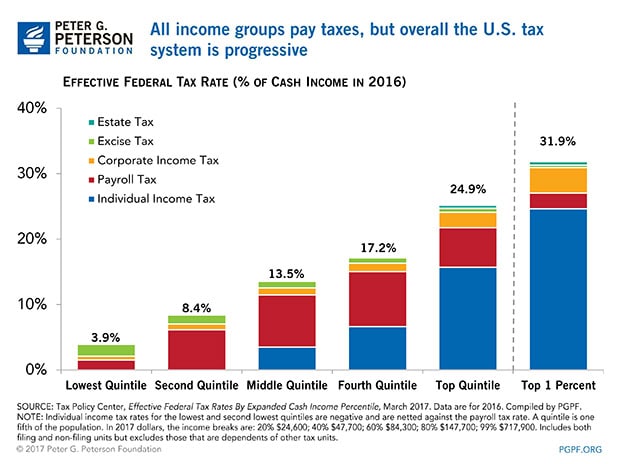
Photo by Chip Somodevilla/Getty Images
Further Reading
Budget Basics: What Is the Child Tax Credit?
The CTC provides assistance to families with children, and while it represents a relatively modest part of overall government spending, it is one of the largest tax expenditures.
Budget Basics: Tax Expenditures
Tax expenditures can come in the form of exclusions, exemptions, deductions, and credits.
How Did the One Big Beautiful Bill Act Change Tax Policy?
See how OBBBA restructured the tax landscape across four major areas: individual tax provisions, business tax provisions, energy tax credits, and health-related tax changes.


