The end of 2024 marks another year that the country has failed to improve its daunting fiscal outlook. For the second year in a row, the deficit was uncomfortably close to $2 trillion, driven in large part by rising interest costs on the national debt. Furthermore, the trust funds for programs that support older Americans have gotten closer to depletion – and automatic cuts are looming for millions of Americans. Below are seven charts that highlight the key fiscal stories and trends from 2024.
1. Debt outpaced economic growth. Debt held by the public (DHBP), the metric economists generally regard as the most meaningful measurement of debt, reached $29 trillion in 2024. That is $2 trillion more than at the end of 2023 and represents 99 percent of GDP (up from 97 percent in 2023). Looking ahead, DHBP is expected to exceed 100 percent of GDP in 2025 and is projected to continue growing faster than the economy in the future.
2. The deficit in 2024 again approached $2 trillion. In fiscal year (FY) 2024, the Department of the Treasury reported a total deficit of $1.8 trillion, $138 billion more than in FY23. However, an accounting adjustment in FY23 stemming from the Supreme Court decision about the Administration’s plan for student loan forgiveness led to a $330 billion reduction in spending to reverse costs that were recorded the previous year (when the plan was announced). Accounting for that reduction, as well as a shift in certain payments because the fiscal year began on a weekend, the adjusted deficit for FY23 was $2.0 trillion. Adjusting for timing shifts would also have raised the deficit for FY24 to $1.9 trillion, making last year the second year in a row that the federal deficit was around $2 trillion.
3. The deficit increased despite continued solid employment. Throughout 2024, the unemployment rate was between 3.7 and 4.2 percent, just above the 55-year low of 3.4 percent achieved in 2023. However, the federal deficit increased despite sustained low unemployment. Historically, deficits have decreased in times of low unemployment, primarily due to increased tax revenues along with lower spending on social programs like unemployment insurance, Medicaid, and the Supplemental Nutrition Assistance Program. Over the past 50 years, deficits averaged 2.4 percent of gross domestic product (GDP) when unemployment was low (less than 6 percent) compared to 5.0 percent when unemployment was higher. By contrast, unemployment in 2024 averaged 4.0 percent, but the deficit totaled 6.7 percent of GDP.
4. The structural mismatch between spending and revenues continued to worsen. At the heart of America’s complex fiscal challenge is a simple math problem: revenues don’t keep up with spending. Unfortunately, that structural imbalance worsened in 2024. In total, revenues were up by 11 percent ($479 billion) in 2024 compared to 2023, with individual and corporate income taxes accounting for most of that increase. Most of that growth is attributable to a rise in amounts withheld from paychecks, reflecting wage and salary growth, and an increase in nonwithheld tax payments, primarily because of the postponement of tax payments for those affected by natural disasters. Total spending was up by 10 percent ($617 billion), more than a third of which came from one category: net interest costs ($222 billion). Other categories that increased significantly were Social Security ($107 billion), defense spending ($53 billion), and Medicare ($27 billion).
5. Interest rates were elevated for most of the year. At the start of 2024, the federal funds rate sat at its highest mark in nearly two decades, putting upward pressure on rates across the economy. As a result, the 3-month Treasury bill was around 5.5 percent, near the highest mark since 2000. Similarly, the 10-year Treasury note reached 4.7 percent in April 2024, which, excluding 2023, was the highest mark since 2007. Near the end of 2024, the Federal Reserve began to decrease the Fed Funds rate, applying downward pressure to shorter-term Treasury securities. That resulted in the rate on 3-month bills falling nearly a full percentage point between June and September 2024. However, the rate on 10-year notes was less affected because of economic uncertainty.
6. Net interest costs on the national debt grew. Higher interest rates and elevated borrowing led to a significant increase in interest payments. Net interest costs on the national debt grew by 34 percent in 2024 to $882 billion. That is more than double the average costs over the previous 10 years. In 2024, the US spent more on interest than on national defense, Medicaid, or children.
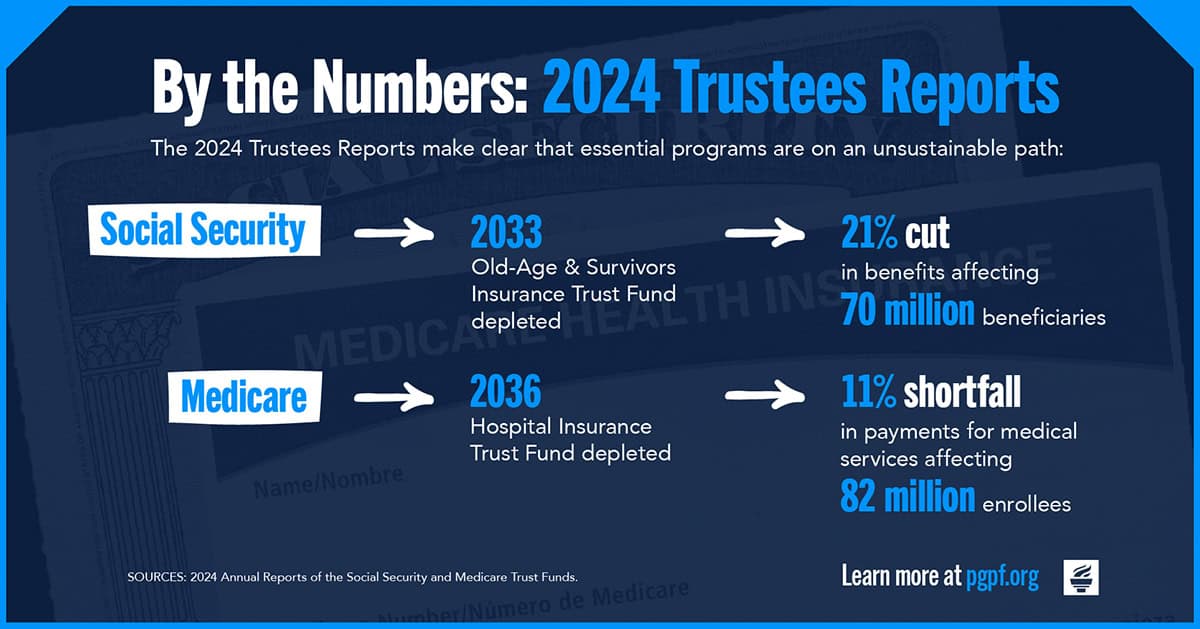
7. Both Social Security OASI and Medicare HI are closer to depletion. While the outlook for Medicare’s Hospital Insurance (HI) Trust Fund improved slightly, the Social Security Old Age and Survivors Insurance (OASI) Trust Fund is projected to become depleted within the next 10 years. If the trust funds become depleted, Medicare could experience an 11 percent shortfall in payments, and Social Security beneficiaries could receive an automatic 21 percent cut in benefits.

Conclusion
In 2024, America’s fiscal outlook continued to deteriorate. The deficit remained high, and trust funds for critical social programs continued progressing towards depletion. Looking to 2025, with a new Administration incoming and much of the tax code up for consideration, the United States has a valuable opportunity to adopt solutions that can improve its outlook by helping to close the structural gap between spending and revenues.
Image by: Jamal Countess/Getty Images
Further Reading
The Fed Reduced the Short-Term Rate Again, but Interest Costs Remain High
High interest rates on U.S. Treasury securities increase the federal government’s borrowing costs.
What Types of Securities Does the Treasury Issue?
Learn about the different types of Treasury securities issued to the public as well as trends in interest rates and maturity terms.
Quarterly Treasury Refunding Statement: Borrowing Up Year Over Year
Key highlights from the most recent Quarterly Refunding include an increase in anticipated borrowing of $158 billion compared to the same period in the previous year.


