10 Charts That Show How the United States Failed to Improve Its Fiscal Outlook in 2023
Last Updated December 11, 2023
The end of 2023 marks another year that the country has failed to improve its daunting fiscal outlook. In fact, the deficit grew significantly in fiscal year 2023, and the key drivers of the national debt are likely to continue on their current trajectory. In addition, interest rates moved higher and have stayed high for longer than initially expected. Furthermore, the trust funds for programs that support older Americans have gotten closer to depletion. Below are 10 charts that highlight the key fiscal stories from 2023.
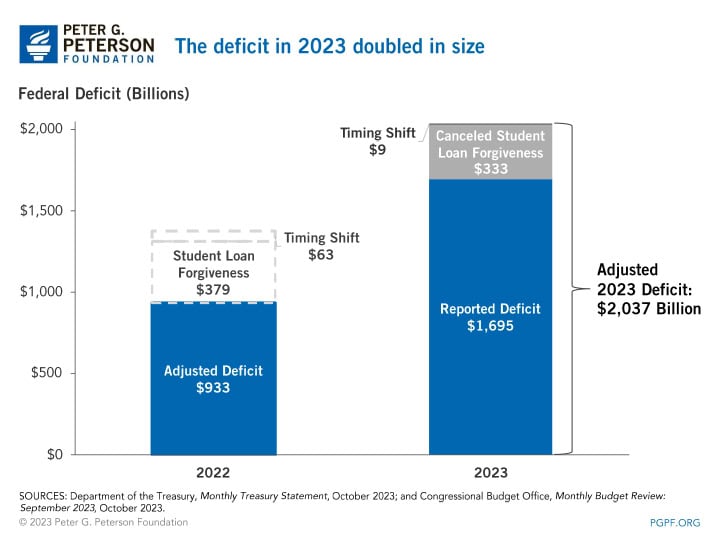
1. The deficit in 2023 totaled $2 trillion. In fiscal year 2023, the federal government reported a total deficit of $1.7 trillion. However, because the Supreme Court overturned the Administration’s plan for student loan forgiveness, a $333 billion reduction in spending was recorded to reverse the expected future costs of that program. Accounting for that reduction as well as certain early payments driven by the fiscal year beginning on a weekend, the adjusted deficit for 2023 was $2.0 trillion, $1.1 trillion more than the adjusted deficit the previous year.
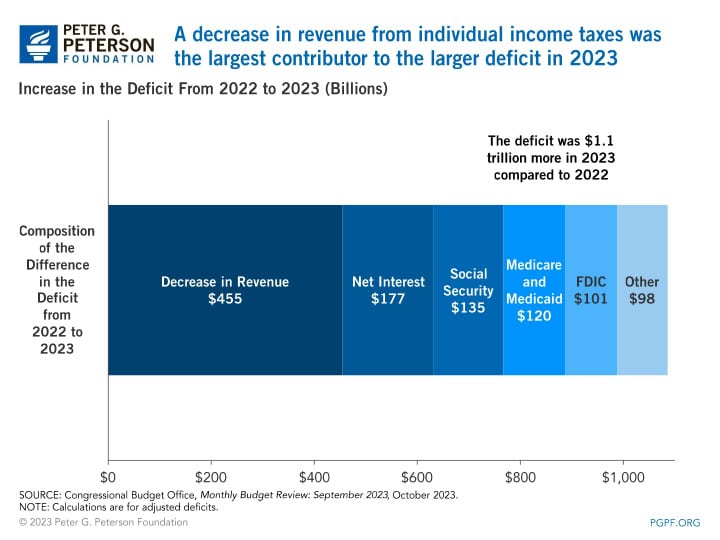
2. A decrease in revenues was the most significant factor in the larger deficit. The primary source of the higher deficit in 2023 was a decrease in revenues. In total, revenues were down by 9 percent in 2023 compared to 2022, with individual income taxes accounting for the majority of that decrease. While more information is needed to fully understand the reasons for the difference, the Congressional Budget Office (CBO) points to a 52 percent increase in individual income tax refunds as well as a filing extension for taxpayers affected by natural disasters (including most taxpayers in California). Net Interest payments on the national debt were the second largest factor that increased the 2023 deficit, mainly driven by higher interest rates.
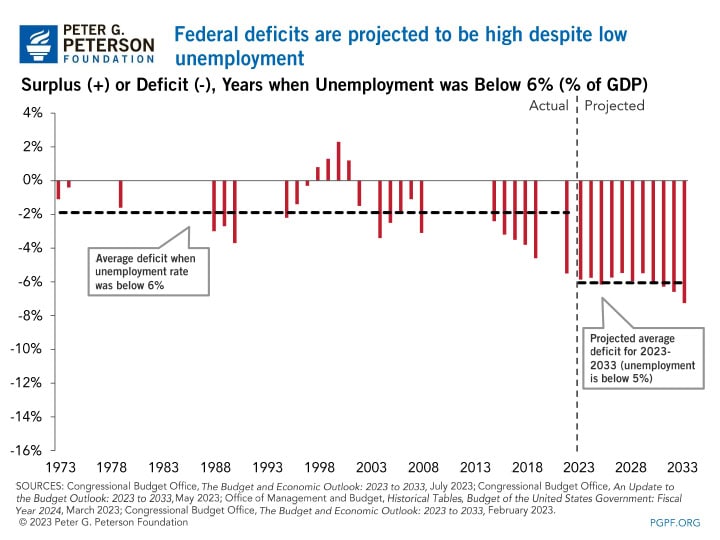
3. The deficit increased despite record low unemployment. In January, the unemployment rate reached 3.4 percent, the lowest since 1969. However, the federal deficit increased significantly despite that record low. Historically, deficits decrease in times of low unemployment, primarily due to increased tax revenues as well as lower spending on social programs like unemployment insurance, Medicaid, and the Supplemental Nutrition Assistance Program. Over the past 50 years, deficits averaged 1.9 percent of gross domestic product (GDP) when unemployment was low (less than 6 percent) compared to 5.1 percent when unemployment was higher. By contrast, unemployment in fiscal year 2023 was 3.6 percent, but the deficit totaled 6.3 percent of GDP.
4. Interest rates continued to increase in 2023. In an effort to bring inflation to its target rate of 2 percent, the Federal Reserve increased the Fed Funds rate four times in 2023, most recently in July. That followed seven increases in 2022. Since then, the average monthly interest rate on the 3-month Treasury bill has been about 5.3 percent, and, in October, it reached its highest point since December 2000. In the same month, the 10-year Treasury bill reached its highest rate since July 2007.
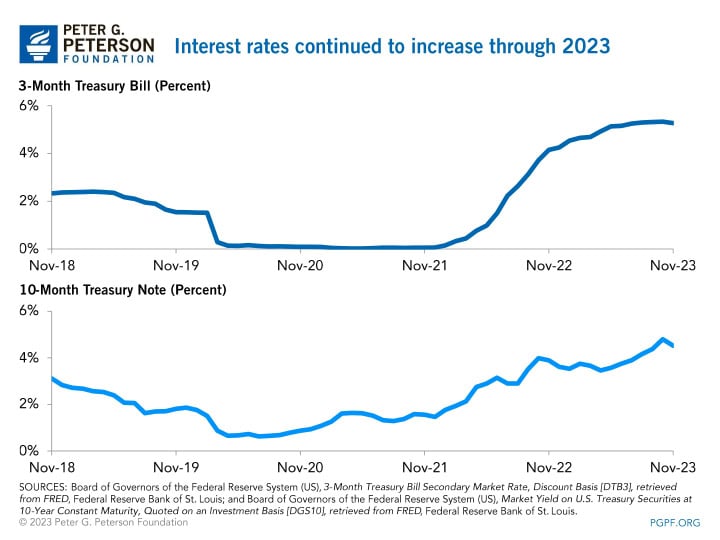
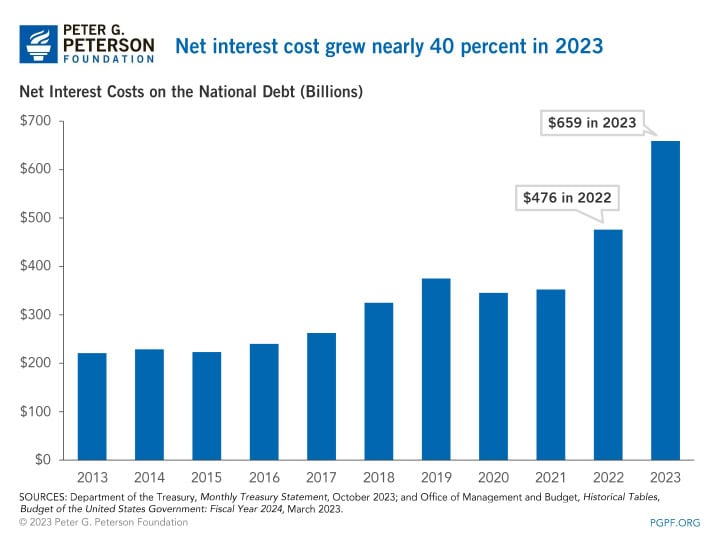
5. Net interest costs on the national debt grew. Higher interest rates led to a significant increase in interest payments. Net interest costs on the national debt grew nearly 40 percent in 2023 to $659 billion. That is more than double average costs over the previous 10 years.
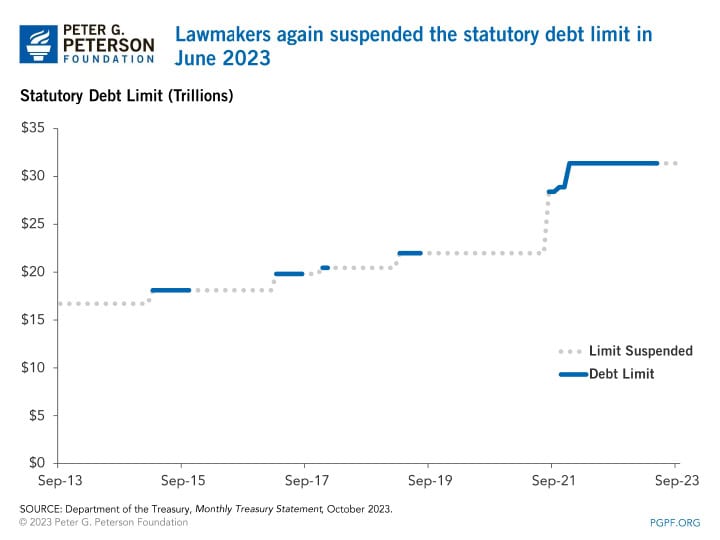
6. Lawmakers suspended the debt limit. On January 19, the federal government hit its debt ceiling, which is the statutory limit on the total amount that the Treasury is able to borrow. To prevent the United States from defaulting on its debt, the Treasury implemented “extraordinary measures,” providing lawmakers additional time to come to a deal that allowed the government to continue borrowing and avert a default. Lawmakers enacted the Fiscal Responsibility Act (FRA) in June, which suspended the debt limit until January 1, 2025. That will be the longest period for which the debt limit has ever been suspended.
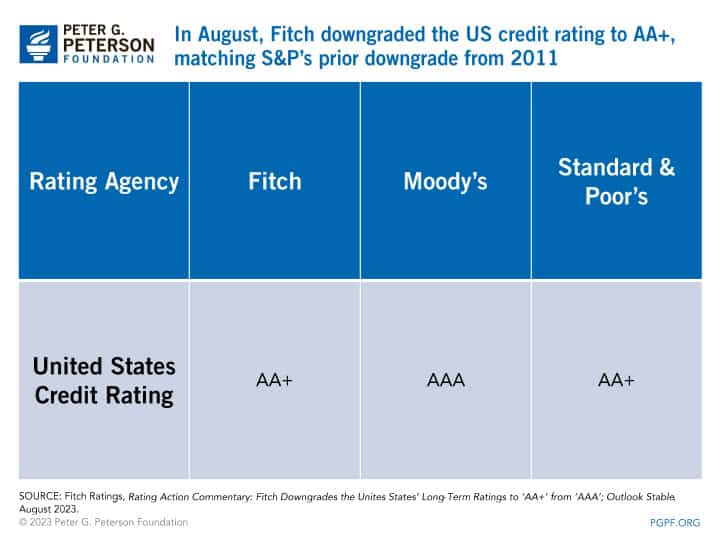
7. Fitch Ratings downgraded the U.S. credit rating. On August 1, Fitch Ratings downgraded the U.S. credit rating from the top ranking of AAA to AA+, marking the second time in history that the United States was downgraded by a major credit-rating agency (following S&P’s decision to downgrade in 2011). The agency noted several reasons for the downgrade, including the high national debt and the erosion of good governance concerning fiscal policy. In particular, Fitch highlighted the federal government’s broken budget process; for example, a complete set of appropriations has not been enacted on time since fiscal year 1997. Partisan brinkmanship over fiscal policy like appropriation bills or the debt limit can erode market confidence in the United States, and lower credit ratings that result from eroded confidence can raise the cost of borrowing and create a cycle of rising interest costs and an increased debt burden. In November, Moody’s Investors Services, the last major credit-rating agency to maintain the AAA rating for the United States, lowered its rating outlook from “stable” to “negative.” In its explanation for the decision, Moody’s cited similar fiscal and governance concerns to Fitch.
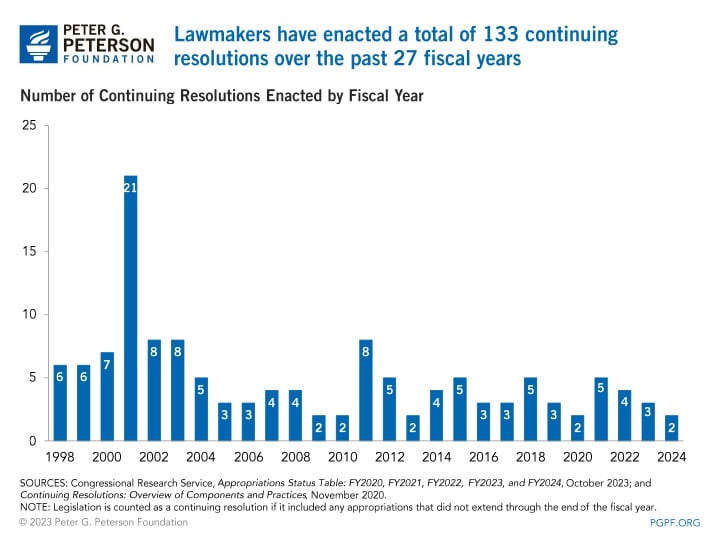
8. Once again, lawmakers had to rely on continuing resolutions to maintain government operations. Two months after the credit downgrade, lawmakers had to again rely on a continuing resolution (CR) to keep the government open. Congress and the President failed to enact any of the 12 appropriation bills needed to fund the government before the start of the new fiscal year on October 1. To prevent a government shutdown, lawmakers enacted a CR to fund agencies at current levels through November 17. However, lawmakers again failed to enact any of the necessary appropriation bills by the new deadline, but they enacted a second CR that extends funding through January 19 for certain agencies and February 2 for the rest.
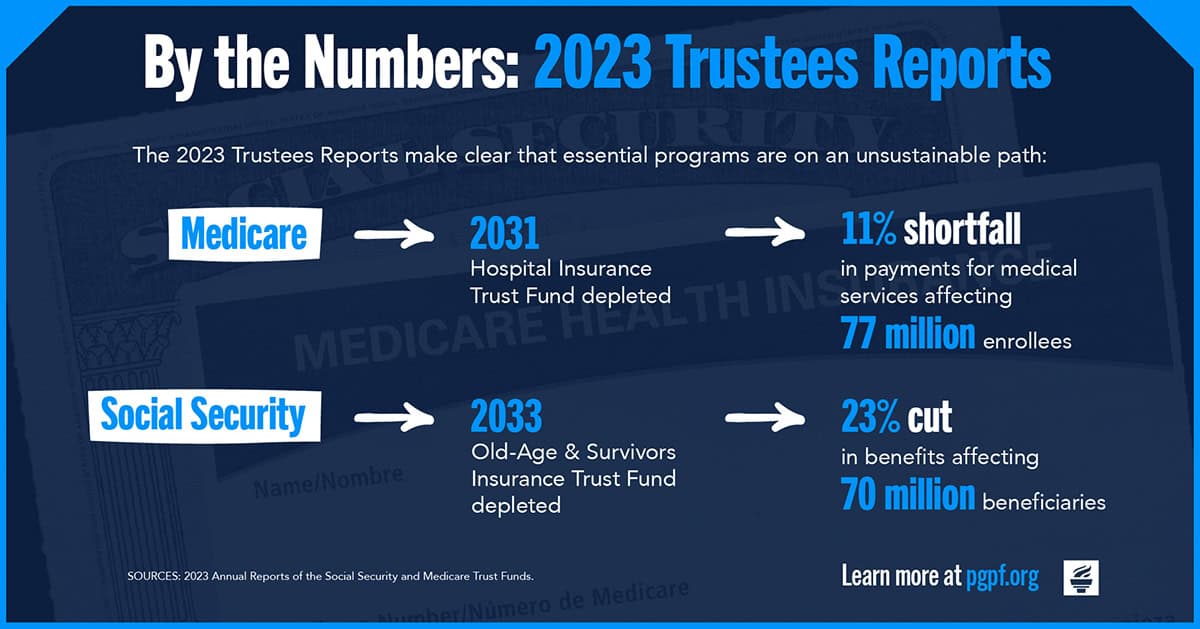
9. Both Social Security OASI and Medicare HI face depletion within the next decade. While the outlook for Medicare’s Hospital Insurance (HI) Trust Fund improved slightly, both the Social Security Old Age and Survivors Insurance (OASI) Trust Fund and the HI Trust Fund are projected to become depleted within the next 10 years: the first time that both trust funds face depletion within a decade. If the trust funds become depleted, Medicare could experience an 11 percent shortfall in payments and Social Security beneficiaries could receive a 23 percent cut in benefits.
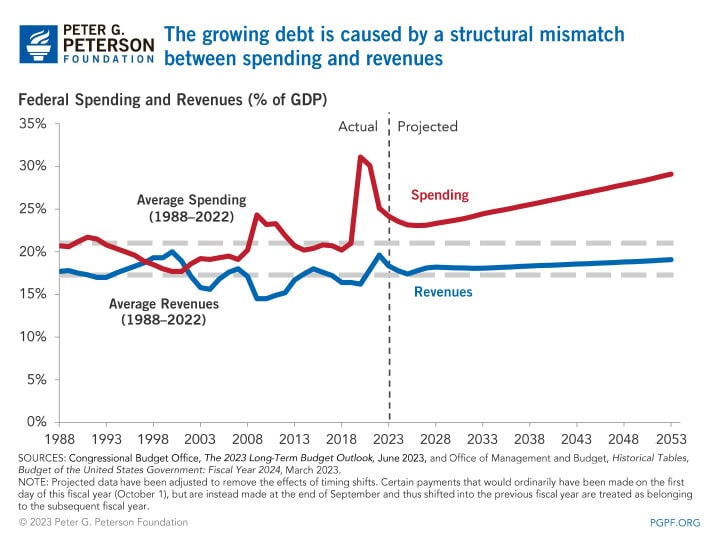
10. The structural mismatch between spending and revenues continued to worsen. America simply does not collect enough revenues to fund the spending promises it has made, and this structural imbalance worsened in 2023. Revenues decreased by 9 percent while outlays increased by 10 percent (after adjustment for the Administration’s proposal for student loan forgiveness). CBO’s fiscal outlook over the next 10 years also worsened. In May, the agency projected that deficits from 2023–2032 would be $3.3 trillion more than it estimated the previous year. Most of that increase is due to new legislation like the Honoring our PACT Act and economic changes that will increase interest payments.
Conclusion
In 2023, the United States failed to implement significant changes to its fiscal policies that would make a lasting improvement to its daunting fiscal and economic outlook. The deficit remained high and the trust funds for key social programs continue to progress towards depletion. Looking to 2024, the United States has the opportunity to adopt solutions that can improve its outlook. Lawmakers must raise or further suspend the debt limit by December 31, 2024, which gives them the opportunity to seriously consider reforms to curb rising debt. Voters, too, will have their voices heard in next year’s elections, with nearly 90 percent supporting the creation of a fiscal commission.
Image by Jorg Greuel/Getty Images
Further Reading
Growing National Debt Sets Off Alarm Bells for U.S. Business Leaders
Debt rising unsustainably threatens the country’s economic future, and a number of business leaders have signaled their concern.
What Is R Versus G and Why Does It Matter for the National Debt?
The combination of higher debt levels and elevated interest rates have increased the cost of federal borrowing, prompting economists to consider the sustainability of our fiscal trajectory.
High Interest Rates Left Their Mark on the Budget
When rates increase, borrowing costs rise; unfortunately, for the fiscal bottom line, that dynamic has been playing out over the past few years.


