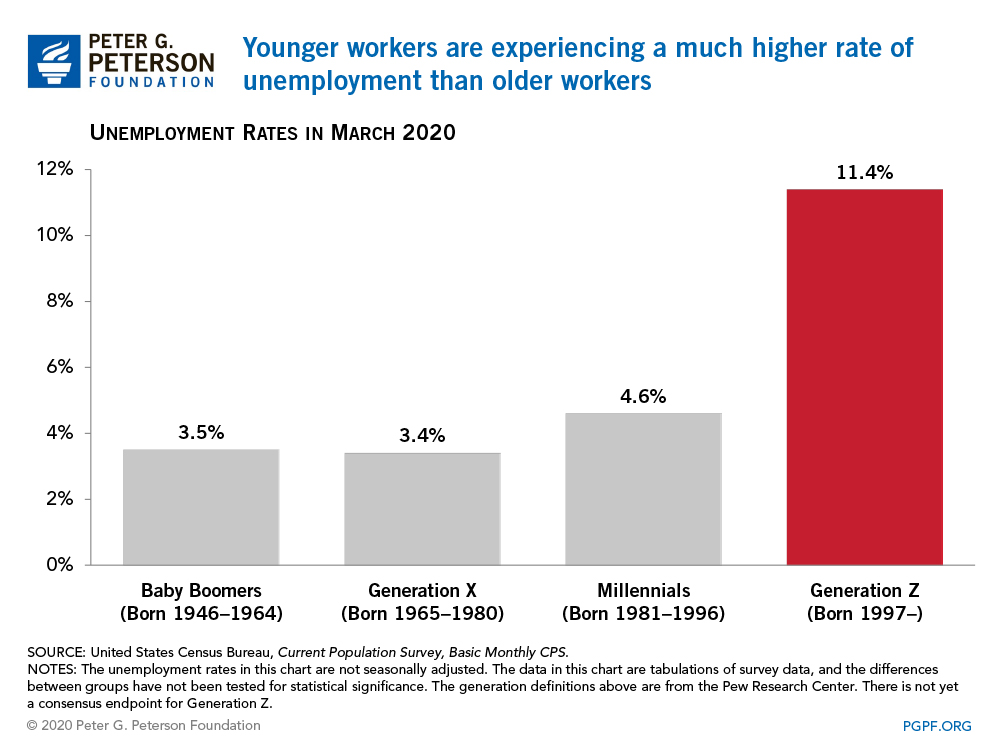
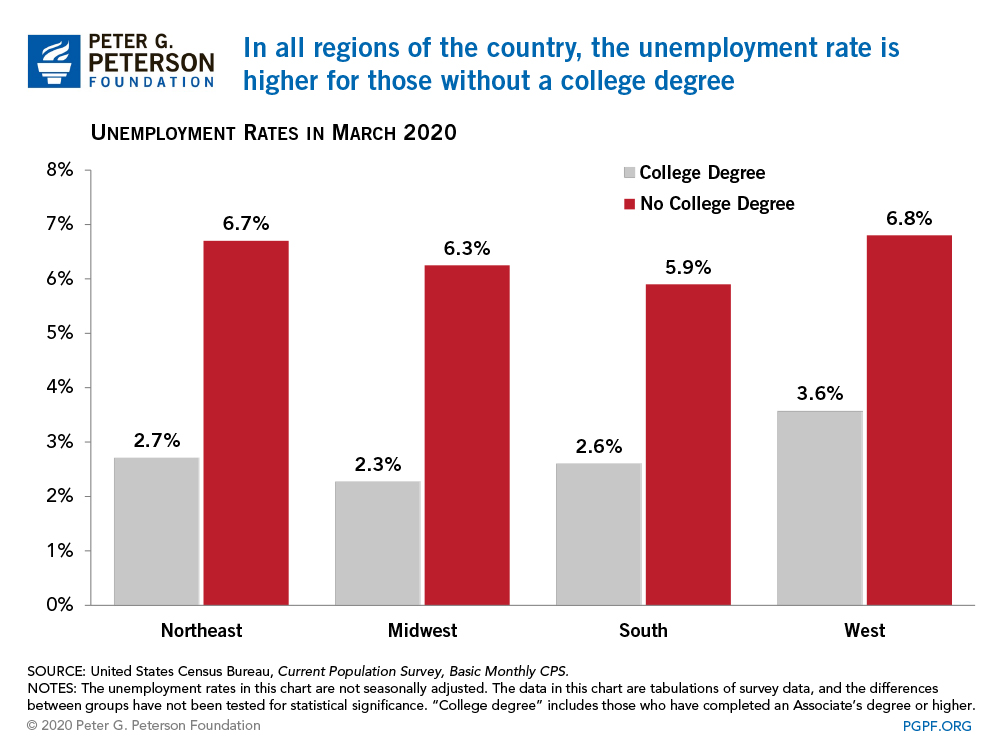
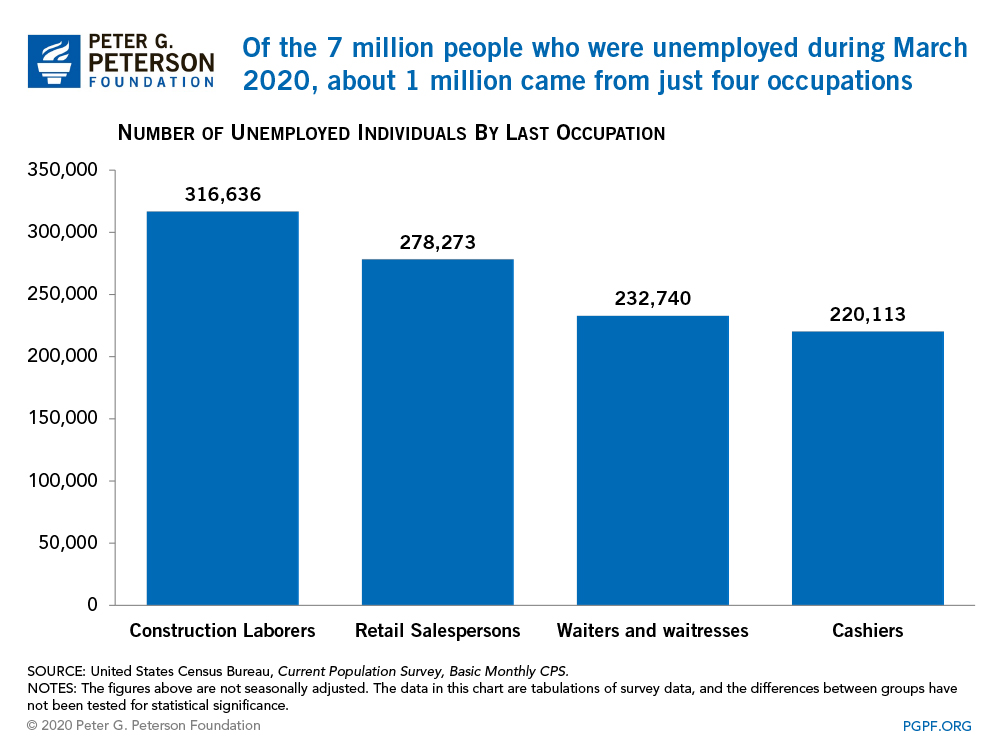
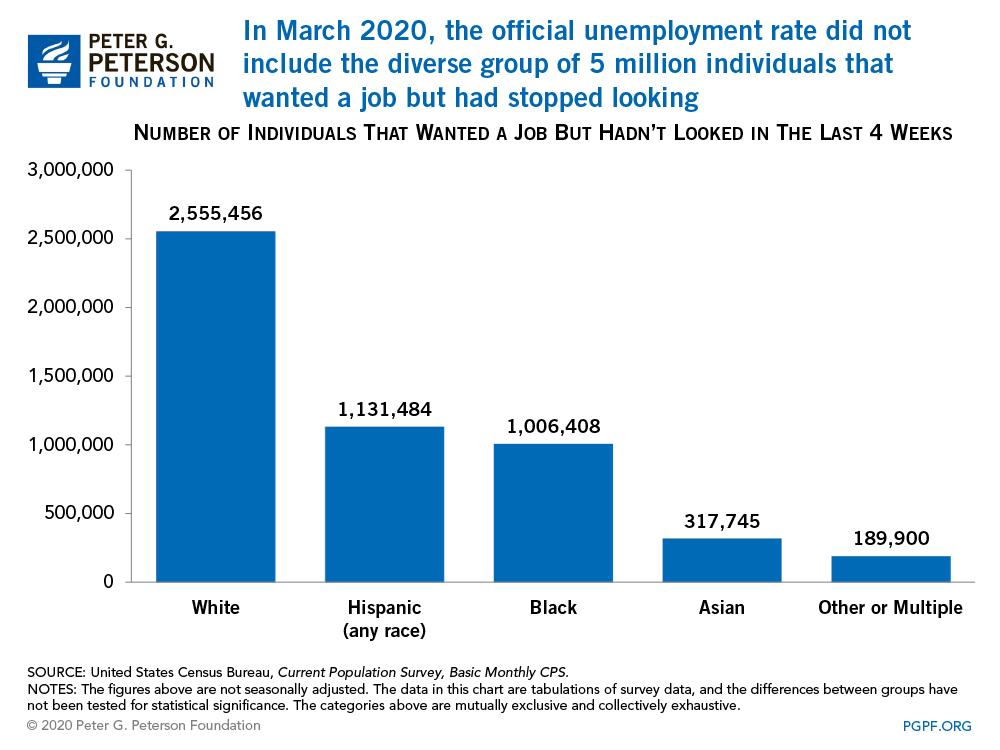
The official unemployment rate was 4.4 percent in March 2020, up from 3.5 percent in February. That increase was the largest of any month since January 1975. The Bureau of Labor Statistics notes, though, that the March reference periods for their surveys predated many business and school closures that occurred in the second half of the month. The charts below provide additional detail on the individuals who reported that they were unemployed in the March report.
1. The unemployment rate was considerably higher for the nation’s youngest workers.

2. Across the country, workers with less than a college degree are facing particularly higher unemployment rates.

3. Those who were unemployed during March most frequently cited the following occupations as the last job that they held.

4. Individuals who want a job but have given up on their job search are not counted in the official unemployment rate. However, there were 5 million such workers in March, and they came from all racial and ethnic groups.

uch of the current labor market data are based on a survey that asked respondents about their employment during the second week of March. As a result, those data only tell part of the story of how the COVID-19 pandemic has upended the labor market, and subsequent data will show even more extreme job losses. Nonetheless, the data available thus far provide a valuable look into where the labor market is heading, and who might need assistance moving forward.
Image credit: Photo by Spencer Platt/Getty Images
Further Reading
National Debt Puts Upward Pressure on Inflation and Interest Rates
America’s unsustainable fiscal outlook can have “significant consequences for price stability, interest rates, and overall economic performance,” according to a new report.
Why Is the Federal Deficit High If Unemployment Is Low?
The U.S. is experiencing an unusual and concerning phenomenon — the annual deficit is high even though the unemployment rate is low.
What Is Inflation and Why Does It Matter?
Here’s an overview of inflation, why it matters, and how it’s managed.


