
You are here
CBO Report Finds Historically High Debt Persists Throughout the Decade

Introduction
Although fiscal policy has commanded nearly the full attention of lawmakers over the past year and a half, the Congressional Budget Office's (CBO's) latest Budget and Economic Outlook indicates that our nation’s finances are still on an unsustainable course. If current law remains unchanged, CBO projects that over the next ten years:
- Debt will remain at levels well above the historical average. By the second half of the decade it will be on a firm upward trajectory, and in 10 years is projected to reach 77 percent of gross domestic product (GDP).
- Although federal revenues will climb as the economy recovers, spending will also grow and deficits are projected to rise to almost $1 trillion by 2023.
- Spending increases will be driven by Social Security, major health care programs, and interest on the debt, which together will claim nearly 80% of projected revenues.
CBO’s projections assume that spending reductions and tax increases take place as scheduled under current laws, even though lawmakers have historically modified many of those provisions. CBO prepares an alternative fiscal scenario that reflects more likely policy choices. Under that scenario, debt is projected to rise to 87 percent of GDP by 2023 — close to the debt levels that have been associated with diminished economic growth.
In the coming months, policymakers face several key policy decisions that could substantially alter the budget outlook. These include sequestration and automatic spending reductions beginning in March; the expiration of the 2013 continuing resolution, which funds many government operations; and the need to address the statutory debt limit again. In weighing these choices, lawmakers can and should accommodate both the short-term needs of the recovering economy and the budget’s long-term structural problems.
The goal of any sustainable fiscal policy should be to stabilize the debt as a share of the economy and put it on a downward path over the long term. CBO’s ten-year projections instead foreshadow the opposite trend and even greater challenges in the long term. Our aging population and rising health care costs will continue to put tremendous stress on the budget. Until policymakers take meaningful steps toward addressing the growing gap between spending and revenue, rising debt will threaten to harm our nation’s future prosperity.
Debt held by the public is projected to remain high relative to historical levels
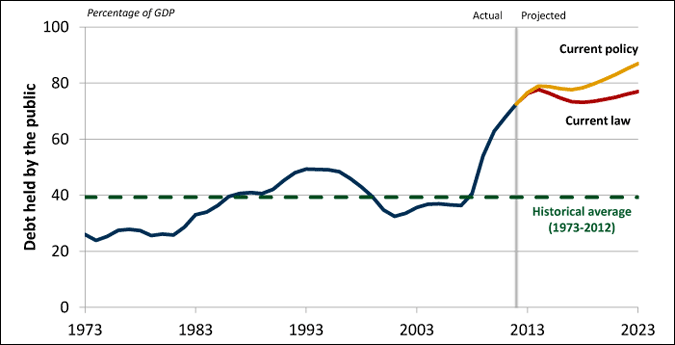
SOURCE: Data from the Congressional Budget Office, Budget and Economic Outlook: Fiscal Years 2013 to 2023, February 2013. Compiled by PGPF.
BUDGET
Although CBO expects that the deficit will decline over the next three years as the economy continues to recover, the agency warns that the budget outlook continues to be perilous. Federal debt will remain at historically high levels in every year for the next 10 years and will be rising in the second half of the decade as retiring baby boomers place increasing demands on Medicare, Medicaid, and Social Security—the major federal programs that serve the elderly.
If current laws remain in place, CBO projects that spending will continue to exceed revenues by wide margins over the next 10 years. Budget deficits will remain high (above $500 billion in all but two years) and, after a brief decline, they will approach $1 trillion by the end of the 10-year period. Cumulatively, budget deficits will total almost $7 trillion from 2014 to 2023 if current laws continue unchanged, according to CBO.
Federal deficits under current law, 2000-2023
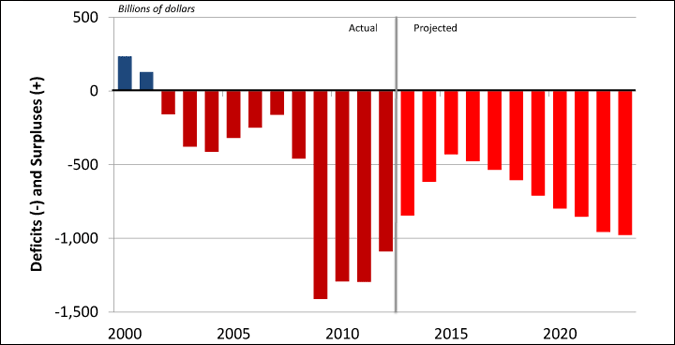
SOURCE: Data from the Congressional Budget Office, Budget and Economic Outlook: Fiscal Years 2013 to 2023, February 2013. Current law baseline projections. Compiled by PGPF.
Despite the dismal outlook, CBO’s current-law baseline is, if anything, optimistic because it doesn’t account for the ways that lawmakers will probably change the law in coming years. Under current law:
- A large number of popular tax breaks for individuals and businesses (including the tax credit for research and experimentation) are scheduled to expire at the end of this year;
- Additional tax provisions are scheduled to expire in future years;
- Medicare payment rates for physicians will drop by 25 percent on January 1, 2014; and
- Budgetary resources for many defense and nondefense programs will be sequestered this year and subject to automatic reductions in future years.
If lawmakers prevent those changes from taking place, as they have routinely done in the past, budget deficits will be substantially larger.
To illustrate the implications of continuing these current policies, CBO prepares an alternative projection that assumes that the tax breaks are extended, the Medicare reimbursement rates are not reduced, and the automatic spending reductions do not take place. Under those current-policy assumptions, CBO estimates that budget deficits will total $9.5 trillion over the next 10 years.
Comparison of CBO's current-law and current-policy deficit projections
Billions of dollars
|
|
10-Year Total: 2014-2023 |
|---|---|
| Current-law deficits | 6,958 |
| Adjustments | |
| Medicare "doc fix" | 138 |
| Extend other expiring tax provisions | 954 |
| No automatic spending cuts as required by the Budget Control Act | 995 |
| Debt service | 446 |
| Subtotal: changes | 2,533 |
| Current-policy deficits | 9,492 |
SOURCE: Data from the Congressional Budget Office, Budget and Economic Outlook: Fiscal Years 2013 to 2023, February 2013. Compiled by PGPF.
NOTE: Numbers may not sum to totals due to rounding.
The cumulative effect of a decade of high deficits under either current law or current policy will cause federal debt to grow to historically high levels as a share of the economy. Under current law, CBO projects that federal debt will climb to 77 percent of GDP by 2023, well above its 40-year historical average of 39 percent and higher than it has been in every year since 1951. Under current policy, federal debt would soar to 87 percent of GDP by 2023 — approaching the 90 percent threshold where debt has been associated with slower economic growth in other countries.
Revenue
CBO projects that revenues will rise from 15.8 percent of GDP in 2012 to 19.1 percent of GDP in 2023. At that level, revenues will be higher than their 40-year average of 17.9 percent.
Revenues will increase as the economy continues to recover from the worst recession since the Great Depression and household incomes (particularly at the high end) continue to grow, pushing more taxpayers into higher tax brackets. CBO also expects a boost to revenues from the rapid growth of taxable distributions from 401(k) retirement accounts, as baby boomers begin to tap those accounts in their retirement.
Revenues will also grow because of changes in policy, notably: the expiration of the payroll tax "holiday," which had reduced the payroll tax on employees from 6.2 percent to 4.2 percent until the end of 2012, and the additional taxes on higher-income families imposed by the American Taxpayer Relief Act and the Affordable Care Act.
CBO's February 2013 budget projections
Percentage of GDP
|
|
Actual 2012 |
2013 | 2014 | 2023 |
Total 2014-2023 |
|---|---|---|---|---|---|
| Current law projections | |||||
| Revenues | 15.8 | 16.9 | 18.0 | 19.1 | 18.9 |
| Spending | |||||
| Mandatory | 13.1 | 13.2 | 13.2 | 14.1 | 13.6 |
| Discretionary | 8.3 | 7.6 | 7.0 | 5.5 | 6.0 |
| Net Interest | 1.4 | 1.4 | 1.5 | 3.3 | 2.5 |
| Total | 22.8 | 22.2 | 21.7 | 22.9 | 22.1 |
| Deficit (-) | -7.0 | -5.3 | -3.7 | -3.8 | -3.3 |
| Debt held by the public | 73 | 76 | 78 | 77 | NA |
|
Current policy projections
|
|||||
| Deficit (-) | -7.0 | -5.5 | -4.7 | -5.0 | -4.4 |
| Debt held by the public | 73 | 77 | 79 | 87 | NA |
SOURCE: Data from the Congressional Budget Office, The Budget and Economic Outlook: Fiscal Years 2013 to 2023, February 2013. PGPF calculated current-policy deficits and debt projections using CBO data.
Spending
CBO projects that federal spending will temporarily decline as the economy recovers. However, after five years, CBO expects that spending will begin to rise again and reach 22.9 percent of GDP by 2023 — which is slightly higher than it was in 2012 and substantially higher than its 40-year average of 20.1 percent. Beneath these aggregate totals, CBO projects that the budget will undergo a massive change. Spending on Social Security and major health care programs will rise sharply as a share of the economy, while spending on everything else, except interest, will decline.
Programmatic Spending
The growth in programmatic spending is driven entirely by Social Security and the federal government’s major health programs: Medicare; Medicaid; the Children’s Health Insurance Program; and the insurance subsidies, exchanges, and related spending required under the Affordable Care Act. As a share of GDP, these entitlement programs are the only major elements of programmatic spending that are growing between 2012 and 2023, and the major health programs account for 74 percent of that growth.
Health and Social Security are the major drivers of non-interest spending
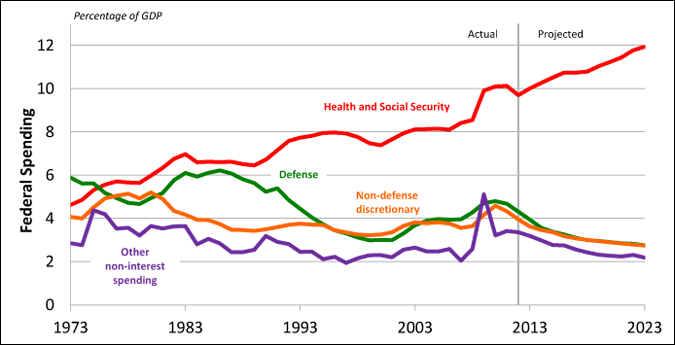
SOURCE: Data from the Congressional Budget Office, Budget and Economic Outlook: Fiscal Years 2013 to 2023, February 2013; Office of Management and the Budget, Historical Tables, February 2012.
NOTE: Health programs include Medicare (net of offsetting receipts), Medicaid, Children’s Health Insurance Program, health insurance subsidies for the exchanges, and other federal health programs.
Social Security is the largest single program in the federal budget. In 2012, the program spent $768 billion and provided benefits to 57 million retirees, surviving spouses and families, and people with disabilities. By 2023, the program will be spending $1.4 trillion as increasing numbers of baby boomers retire and claim benefits.
Major health programs are among the fastest growing categories of the federal budget. In 2012, those programs cost $726 billion (net of premiums for Medicare) and served 51 million people. By 2023, they will cost $1.6 trillion — $200 billion more than projected spending for defense and non-defense discretionary programs combined. That amount represents nearly one-third of all projected revenues.
Outlays for those health programs are projected to grow quickly for several reasons. First, as members of the large baby boom generation turn 65, they will become eligible for benefits under the Medicare program — and, if they have low incomes or meet certain requirements, they will become eligible for Medicaid benefits. Second, although the growth of health care costs has moderated in recent years and CBO has accounted for that slowdown in their projections, health costs will continue to add pressure to the budget in the years ahead. Third, as the Affordable Care Act is implemented, growing numbers of people under age 65 will be claiming subsidies to purchase health insurance through exchanges. By CBO’s estimates, 25 million people will be claiming subsidies in 2023. Over the next 10 years, the cumulative cost of the health insurance subsidies, exchanges, and related spending required under the Affordable Care Act will total $950 billion — about 8 percent of the cost of major federal health care programs over the coming decade.
Discretionary outlays will decline sharply as a share of GDP over the next ten years. Spending on these programs — which fund a wide variety of activities, including many of the most popular and recognizable government programs such as national defense, NASA, national parks, law enforcement, courts and more — will fall by about one quarter, from 8.3 percent of GDP in 2012 to 5.5 percent of GDP in 2023.
Discretionary spending is projected to decline well below historical levels under current law
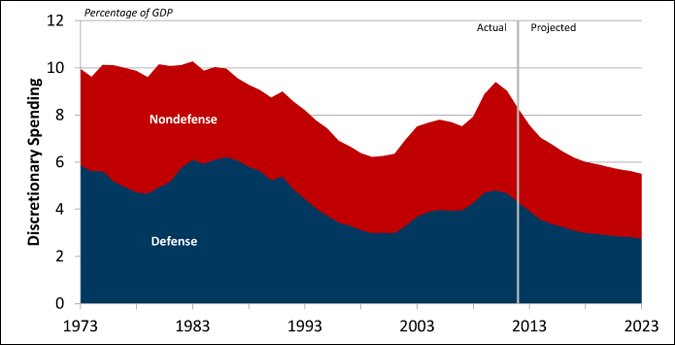
SOURCE: Data from the Congressional Budget Office, Budget and Economic Outlook: Fiscal Years 2013 to 2023, February 2013. Compiled by PGPF.
At that level, discretionary spending would be well below its 40-year average of 8.6 percent of GDP and lower than it has been in any single year over the past four decades. Questions have been raised about whether it will be politically feasible to drive discretionary spending to such low levels and whether it would be desirable to do so, given that some of the activities funded by discretionary programs, such as infrastructure investments, education, and research and development, contribute to future economic growth.
Discretionary spending is reduced to those levels largely because of the Budget Control Act (BCA) of 2011, which established caps on the amount of budgetary authority that could be provided for these programs. In addition, because the supercommittee process failed in 2011 to produce a budget agreement with $1.5 trillion of savings, the BCA requires additional reductions in discretionary funding through a sequestration of budget authority this year and automatic reductions in future years. This year, the sequestration, if carried out, will require cuts of about 8 percent in the resources for defense (other than spending for military personnel) and reductions of about 5 percent in the funding of nondefense programs. If policymakers choose to suspend the automatic spending reductions, discretionary spending would fall to about 5.8 percent of GDP in 2023, which would still be well below its 40-year average.
Other programmatic spending also declines as a share of the economy over the next ten years. This spending funds a wide range of activities for income security (such as food stamps, unemployment compensation, and family support), federal and military retirement, veterans programs, and agricultural support programs, to name a few. The projected reduction in spending on these programs largely stems from an improvement in the economy, which will reduce spending on income support programs.
Interest on the Debt
Interest on the federal debt will climb sharply from $223 billion in 2012 to $857 billion in 2023. Over the decade, interest will become the third largest category of the federal budget. Outlays for federal interest will exceed spending on defense discretionary programs, nondefense discretionary programs, Medicaid, or other mandatory programs.1
Interest costs will be the third largest category of the budget in 2023
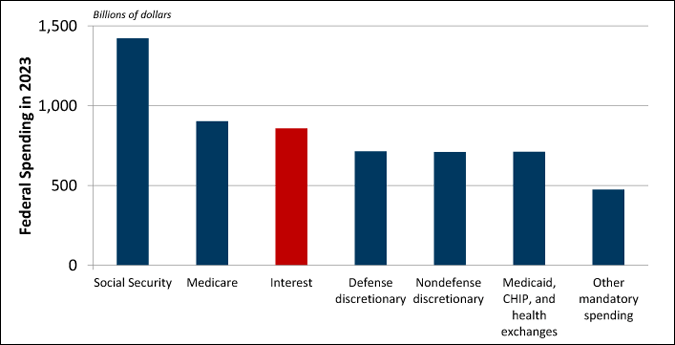
SOURCE: Data from the Congressional Budget Office, Budget and Economic Outlook: Fiscal Years 2013 to 2023, February 2013. Compiled by PGPF.
Note: CHIP=Children's Health Insurance Program.
The rise of interest costs reflects the continuation of large budget deficits and the accumulation of debt as well as an increase of interest rates. Over the past several years, the Federal Reserve has kept interest rates at exceptionally low levels in an effort to stimulate the economy. As the economy recovers, the Federal Reserve is expected to unwind this policy and allow interest rates to rise back up to more normal levels. CBO projects that interest rates on 3-month Treasury bills will climb from 0.1 percent in 2013 to an average of 4.0 percent from 2019 to 2023 and rates on 10-year Treasury notes will climb from 2.1 percent in 2013 to an average of 5.2 percent between 2019 and 2023.
ECONOMY
CBO continues to project a very slow recovery from the 2007-2009 recession. The unemployment rate is projected to remain above 7.5 percent through next year, which will be the sixth consecutive year that the unemployment rate will be at that level or above and the longest stretch of unemployment above 7.5 percent for the past 70 years. Moreover, the economy is not expected to be at full employment until 2017. If those projections are realized, the 2007-2009 recession will have produced almost a decade of lost growth.
The labor market will not be back to full employment until 2017
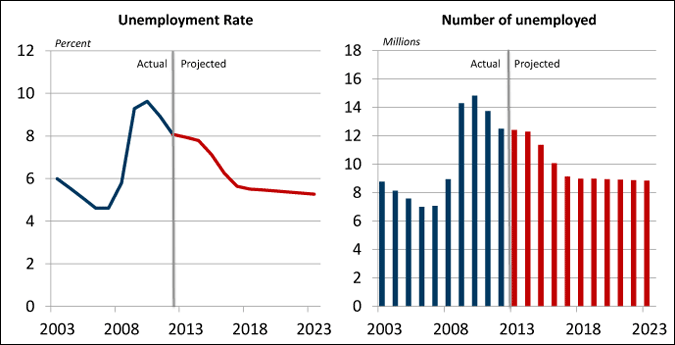
SOURCE: Calculations by PGPF using data from the Bureau of Labor Statistics, Labor Force Statistics from the Current Population Survey, February 2013; Congressional Budget Office, Budget and Economic Outlook: Fiscal Years 2013 to 2023, February 2013.
NOTE: The number of unemployed is the number of people in the labor force less the number of employed workers.
CBO also projects that the economy will soften in 2013, but that growth will pick up in future years. GDP growth was 1.9 percent in 2012, but it is expected to slow to 1.4 percent in 2013 before rising to 3.4 percent in 2014. However, as the baby boomers begin to retire in large numbers, CBO projects a substantial slowing in the growth of the labor force — and the economy — in the second half of the next decade. Over the 2019-2023 period, the labor force is projected to grow by only 0.5 percent per year, well below its average annual growth rate of 1.5 percent from 1950 to 2012. And as the labor force growth slows and debt rises, the overall economy will advance at a pace of only 2.2 percent from 2019 to 2023.
CBO's February 2013 economic assumptions
In Percent
| 2012 | 2013 | 2014 | 2015-2018 | 2019-2023 | |
|---|---|---|---|---|---|
| Real GDP growtha | 1.9 | 1.4 | 3.4 | 3.6 | 2.2 |
| Unemployment rateb | 8.1 | 7.9 | 7.8 | 6.1 | 5.4 |
| Inflation ratea | 1.5 | 1.3 | 1.8 | 1.9 | 2.0 |
| Three-month Treasury billsb | 0.1 | 0.1 | 0.2 | 2.2 | 4.0 |
| Ten-year Treasury notesb | 1.8 | 2.1 | 2.7 | 4.5 | 5.2 |
SOURCE: Data from the Congressional Budget Office, The Budget and Economic Outlook: Fiscal Years 2013 to 2023, February 2013. Compiled by PGPF. Inflation rate is based on the PCE price index.
a. Fourth quarter to fourth quarter percentage change
b. Calendar year average
The 2013 slowdown is due to the tightening of federal fiscal policy because of the sequester of defense and nondefense funding this year, the expiration of the payroll tax holiday at the end of 2012, and the increase in taxes on higher-income families from the American Taxpayer Relief Act and the Affordable Care Act. CBO estimates that without those factors the economy would grow at 1.5 percentage points faster in 2013. Although less tightening in 2013 would produce stronger near-term growth, CBO warns that if it is not accompanied instead by tightening in future years, the economy would be weaker by the middle of the decade because of the higher federal debt.
Indeed, CBO paints a dismal picture of our economy if policymakers fail to bring our debts under control. The agency warns that allowing debt to rise to 77 percent of GDP, as projected under current law, would have "serious negative consequences." High and rising debts will reduce national saving, slow the growth of productivity, and lower wages. Policymakers will have less flexibility for responding to unexpected challenges such as another recession or natural disaster. The nation will also face a greater risk of a fiscal crisis, in which investors lose confidence in the ability of U.S. policymakers to manage our country’s fiscal affairs, demand higher interest rates on U.S. debt, and end the ability of the United States to borrow at easy terms and affordable rates.
Conclusion
Policymakers have devoted a great deal of attention to the budget over the last year and a half, yet CBO's latest Budget and Economic Outlook indicates that our nation’s finances are still set on an unsustainable course. Although annual deficits are expected to shrink for the next few years, the federal government will continue to borrow at unprecedented levels. Furthermore, by 2017, deficits are expected to begin rising again. As a result, CBO projects that debt will hit 77 percent of GDP by 2023.
Based upon policymakers’ past actions, it is likely that the debt will take an even higher path, reaching 87 percent of GDP over the next 10 years. That level would approach the elevated range of debt that many economists find could be harmful to economic growth.
Beyond the ten-year window shown in CBO’s latest projections, the trends are even more troubling. The aging of our population, retirement of baby boomers, and rising health care costs will increase spending for Social Security and federal health care programs. At the same time, unless current policies change, federal revenues will flatten as a share of the economy. The resulting long-term gap between spending and revenues will present growing risks to our future economy and require increasingly difficult policy choices.
Due to the demographic nature of the main drivers of long-term debt, the nation cannot afford to wait to begin implementing policy reforms. As CBO notes, "Deciding now what policy changes to make to resolve that long-term imbalance [between spending and revenues] would allow for gradual implementation, which would give households, businesses, and state and local governments time to plan and adjust their behavior."
Crafting changes to federal revenues and spending to address our long-term structural debt is not easy. But the alternative is really no alternative at all. Our future prosperity rests on a growing economy and a stabilized debt, and Congress and the President must continue to focus on both. A comprehensive fiscal plan that is phased in gradually is key to our fiscal and economic health.
Budget Projections: Fiscal Years 2012 to 2023
|
Actual 2012 |
2013 | 2014 | 2015 | 2016 | 2017 | 2018 | 2019 | 2020 | 2021 | 2022 | 2023 |
Total 2014-2023 |
|
| In Billions of Dollars | |||||||||||||
| Current Law Projections | |||||||||||||
| Revenues | 2,449 | 2,708 | 3,003 | 3,373 | 3,591 | 3,765 | 3,937 | 4,101 | 4,297 | 4,496 | 4,734 | 4,961 | 40,241 |
| Spending | |||||||||||||
| Mandatory | 2,031 | 2,116 | 2,205 | 2,342 | 2,535 | 2,655 | 2,768 | 2,924 | 3,087 | 3,263 | 3,501 | 3,658 | 28,938 |
| Discretionary | 1,285 | 1,213 | 1,170 | 1,189 | 1,209 | 1,233 | 1,257 | 1,293 | 1,324 | 1,356 | 1,396 | 1,424 | 12,852 |
| Net Interest | 223 | 224 | 243 | 272 | 323 | 412 | 517 | 593 | 667 | 730 | 795 | 857 | 5,410 |
| Total | 3,538 | 3,553 | 3,618 | 3,803 | 4,067 | 4,300 | 4,542 | 4,811 | 5,078 | 5,350 | 5,691 | 5,939 | 47,199 |
| Deficit | -1,089 | -845 | -616 | -430 | -476 | -535 | -605 | -710 | -798 | -854 | -957 | -978 | -6,958 |
| Debt | 11,280 | 12,229 | 12,937 | 13,462 | 14,025 | 14,642 | 15,316 | 16,092 | 16,957 | 17,876 | 18,902 | 19,944 | NA |
| Current Policy Projections | |||||||||||||
| Deficit | -1,089 | -887 | -778 | -644 | -691 | -755 | -839 | -976 | -1,080 | -1,154 | -1,268 | -1,307 | -9,492 |
| Debt | 11,280 | 12,271 | 13,141 | 13,881 | 14,658 | 15,496 | 16,403 | 17,446 | 18,592 | 19,811 | 21,149 | 22,519 | NA |
| In Percent of GDP | |||||||||||||
| Current Law Projections | |||||||||||||
| Revenues | 15.8 | 16.9 | 18.0 | 19.1 | 19.1 | 18.9 | 18.8 | 18.7 | 18.7 | 18.9 | 19.0 | 19.1 | 18.9 |
| Spending | |||||||||||||
| Mandatory | 13.1 | 13.2 | 13.2 | 13.3 | 13.5 | 13.3 | 13.2 | 13.4 | 13.5 | 13.7 | 14.1 | 14.1 | 13.6 |
| Discretionary | 8.3 | 7.6 | 7.0 | 6.7 | 6.4 | 6.2 | 6.0 | 5.9 | 5.8 | 5.7 | 5.6 | 5.5 | 6.0 |
| Net Interest | 1.4 | 1.4 | 1.5 | 1.5 | 1.7 | 2.1 | 2.5 | 2.7 | 2.9 | 3.1 | 3.2 | 3.3 | 2.5 |
| Total | 22.8 | 22.2 | 21.7 | 21.6 | 21.6 | 21.5 | 21.7 | 22.0 | 22.2 | 22.4 | 22.9 | 22.9 | 22.1 |
| Deficit | 7.0 | 5.3 | 3.7 | 2.4 | 2.5 | 2.7 | 2.9 | 3.2 | 3.5 | 3.6 | 3.8 | 3.8 | -3.3 |
| Debt | 73% | 76% | 78% | 76% | 75% | 73% | 73% | 74% | 74% | 75% | 76% | 77% | NA |
| Current Policy Projections | |||||||||||||
| Deficit | 7.0 | -5.5 | -4.7 | -3.7 | -3.7 | -3.8 | -4.0 | -4.5 | -4.7 | -4.8 | -5.1 | -5.0 | -4.4 |
| Debt | 73% | 77% | 79% | 79% | 78% | 78% | 78% | 80% | 81% | 83% | 85% | 87% | NA |
SOURCE: Data from the Congressional Budget Office, The Budget and Economic Outlook: Fiscal Years 2013 to 2023, February 2013. Compiled by PGPF.
1Other mandatory outlays are net of offsetting receipts (except those for Medicare).