You are here
Congressional Budget Office's 2015 Long-Term Budget Outlook
In its 2015 Long-Term Budget Outlook, the nonpartisan Congressional Budget Office (CBO) warns once again that federal debt is on an unsustainable path. Unless policymakers act, CBO concludes that rising debt could jeopardize long-term economic growth, crowd out critical public investments, reduce policymakers’ flexibility to respond to unforeseen events, and raise the risk of a fiscal crisis.
CBO’s Long-Term Budget Outlook includes the following projections, trends and analysis:
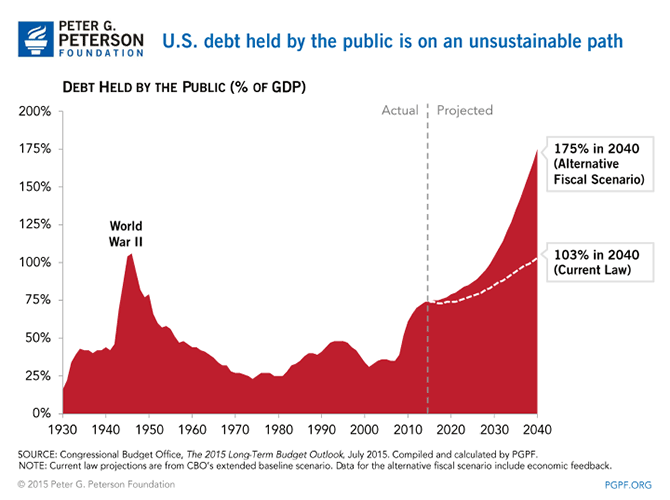
- By 2040, federal debt will climb to over 100 percent of GDP under current law, and could reach 175 percent of GDP under less optimistic assumptions.
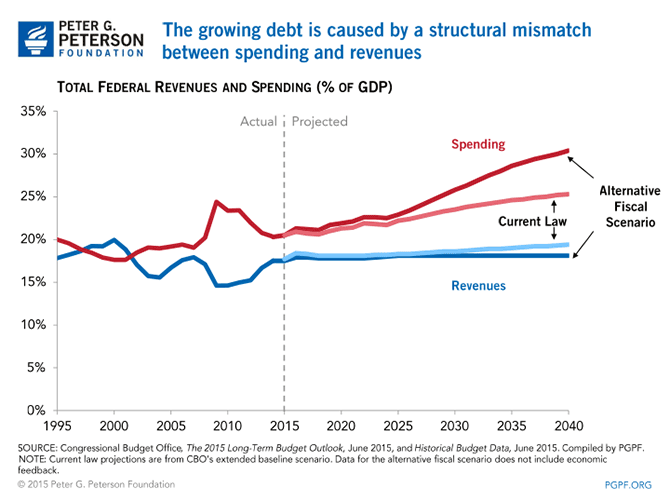
- Rising debt is a result of a structural imbalance between revenues and spending, fueled by two primary drivers: the aging of the population and healthcare cost growth.
- Interest costs on federal debt are projected to grow rapidly: by 2022, they could exceed what the federal government has historically spent on R&D, infrastructure, and education combined, and could exceed them by more than three times by 2050.
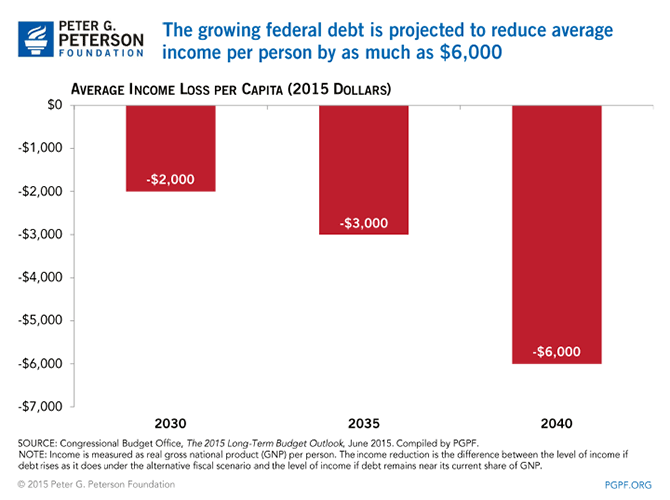
- Rising debt will harm our economy and slow the growth of productivity and wages: CBO estimates that it could reduce average real (inflation-adjusted) income per person by as much as $6,000 in 2040.
Significant changes to some combination of spending and tax policies will be required to help put our long-term debt on a sustainable path, and CBO’s report concludes that taking action now to address these trends would provide significant benefits. As CBO states, “the sooner significant deficit reduction was implemented, the smaller the government’s accumulated debt would be; the smaller the policy changes would need to be to achieve the chosen goal; and the less uncertainty there would be about what policies might be adopted."
CBO PROJECTS THAT FEDERAL DEBT IS ON AN UNSUSTAINABLE PATH
CBO estimates that federal debt, which is already at high levels, will climb significantly over the next 25 years. In CBO’s latest projections, debt is expected to climb from 74 percent of GDP in 2015 to 103 percent of GDP in 2040 (assuming no changes in current law). But under less optimistic assumptions, CBO projects that debt could soar to a staggering 175 percent of GDP. (See the appendix for a description of CBO’s two budget scenarios).
Debt at 175 percent of GDP would be unprecedented. Over the past 50 years, debt averaged only 38 percent of GDP and, as recently as 2007, was as low as 35 percent of GDP. Since 1790, our debt has never exceeded 100 percent of GDP, except for a brief time during World War II, after which the debt fell rapidly as a share of GDP.
RISING DEBT WILL HARM OUR ECONOMY
Absent reforms, our growing debt will have serious and far-reaching economic consequences. CBO warns that these levels of debt:
"…would have significant negative consequences for the economy in the long term and would impose significant constraints on future budget policy. The projected amounts of debt would reduce the total amounts of national saving and income in the long term; increase the government’s interest payments, thereby putting more pressure on the rest of the budget; limit lawmakers’ flexibility to respond to unforeseen events; and increase the likelihood of a fiscal crisis."
Rising debt will slow the growth of the economy by crowding out private and public investment, thereby slowing the growth of productivity and workers’ wages. CBO estimates that rising debt could reduce average real (inflation-adjusted) income per person by as much as $6,000 in 2040, relative to what it would be if the debt was stabilized at today’s levels. This represents a 7.5 percent loss in income.
WHY DOES THE DEBT GROW SO MUCH?
The growth of our debt stems from a fundamental imbalance between spending and revenues. Under current law assumptions, CBO anticipates that federal spending will grow from 20.5 percent of GDP in 2015 to 25.3 percent of GDP in 2040. Revenues are also projected to increase during this period, growing from 17.7 percent of GDP in 2015 to 19.4 percent in 2040 — but not by enough to match the projected growth of federal spending.
Under less optimistic alternative assumptions, the mismatch between spending and revenues is even more pronounced. CBO projects that spending will soar to 30.4 percent of GDP in 2040, while revenues grow only slightly and stabilize 18.1 percent of GDP.
Much of the growth in total spending is caused by growing interest costs, which in turn further increases federal debt. Indeed, over the next 25 years, more than half of the growth in federal spending is projected to come from rising interest costs. Those growing costs are avoidable if lawmakers enact policies that put our debt on a sustainable path.
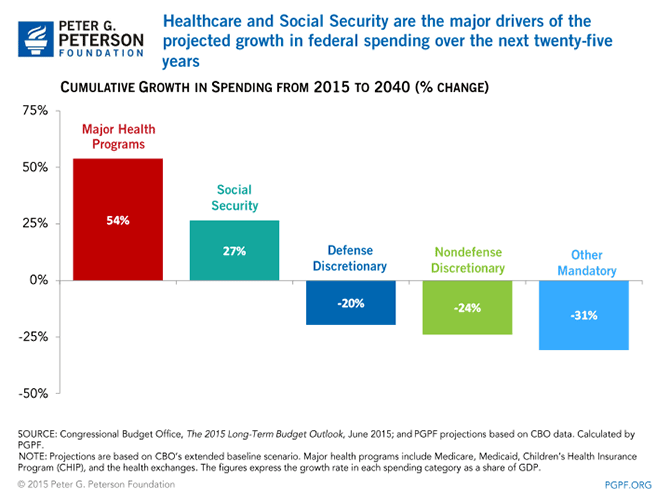
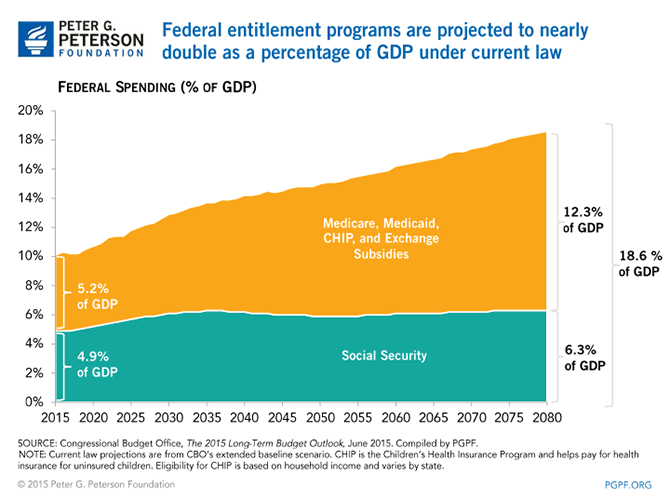
Beyond interest costs, 100 percent of the growth in non-interest spending (as a percentage of GDP) comes from Social Security and the major health programs, under current law. Healthcare by itself accounts for approximately 70 percent of this growth. From 2015 to 2040, healthcare spending as a share of the economy is projected to grow by 54 percent, while Social Security spending is expected to grow by 27 percent. Together, spending on these two budget categories is projected to grow from 10.1 percent of GDP in 2015 to 14.2 percent of GDP in 2040. By 2080, spending on Social Security and major healthcare programs is projected to rise to 18.6 of GDP, almost double its 2015 level. By contrast, spending on all other categories of the budget, which include critical areas such as national defense, transportation, law enforcement, and public health research, is projected to decline as a percentage of GDP and then stabilize, under current law.
WHAT DRIVES THE GROWTH OF SPENDING?
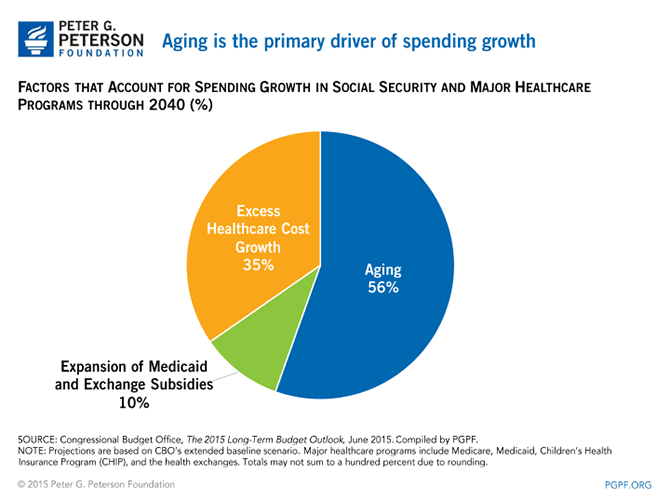
There are three primary factors that account for the growth of spending on Social Security and major healthcare programs: aging of the population, the growth of healthcare costs per capita, and the expansion of subsidies provided through the healthcare exchanges created by the Affordable Care Act (ACA).
-
Aging of the population is the most important factor driving spending over the next 25 years. CBO estimates that aging alone will account for 56 percent of projected growth in federal spending for major health programs and Social Security through 2040.
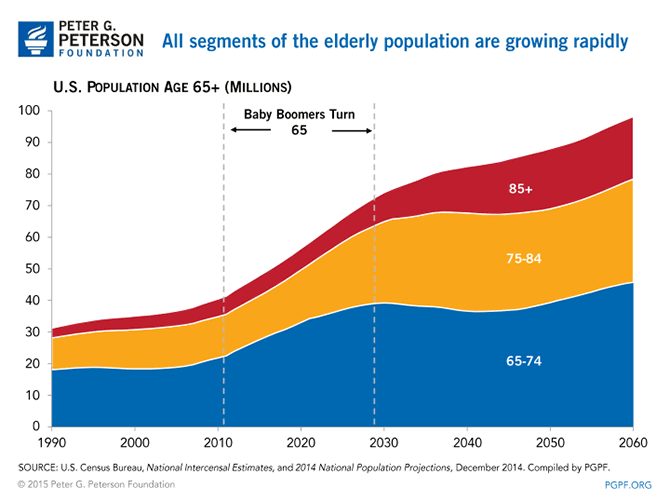
The aging of the population is the result of baby boomers entering retirement years and people living longer. The number of people aged 65 and older are projected to increase from 48 million in 2015 to over 80 million in 2040. Within 25 years, one quarter of the adult population will be 65 or older.
These trends will put significant pressure on the federal budget by driving up spending on mandatory programs that primarily serve older populations, such as Social Security, Medicare, and Medicaid. CBO projects that outlays for Social Security will exceed its revenues by nearly 30 percent in 2025, and by more than 40 percent in 2040, under current law — fully exhausting the combined Social Security trust funds in 2029.
-
Growing healthcare costs is the second major driver of spending, accounting for 35 percent of the growth of spending on Social Security and the major healthcare programs over the next 25 years. Healthcare costs have grown less rapidly in recent years, which is welcome news. However, some of this slowdown in growth may be due to a weak economy following the recession, rather than permanent efficiencies in the healthcare sector. CBO has incorporated the slowdown in healthcare cost growth into its projections. However, even with these more modest growth projections, CBO still projects that current-law spending on major healthcare programs will climb sharply over the next 25 years — rising more than 50 percent, from 5.2 percent of GDP in 2015 to 8.0 percent of GDP in 2040. CBO also projects that healthcare spending by all sectors of the economy — government, business, and consumers — will climb to 25 percent of GDP by 2040.
- The expansion of federal support for health insurance, through Medicaid expansion and the healthcare exchange subsidies, is the third factor behind the growth of federal healthcare spending. As more people enroll in health insurance plans under the ACA, the costs will also rise. However, CBO projects that the expansion of federal support for health insurance is largely a near-term driver of costs, and its projections show slower growth over time as enrollment stabilizes.
THE GROWING BURDEN OF INTEREST COSTS
One of the most damaging effects of rising debt is rapidly growing interest costs. Under current law, CBO projects that interest payments on the debt will more than double over the next 25 years, climbing from 6 percent of federal spending in 2015 to 17 percent in 2040. Under less optimistic assumptions, interest costs are projected to more than triple over the next 25 years to 21 percent of total spending.
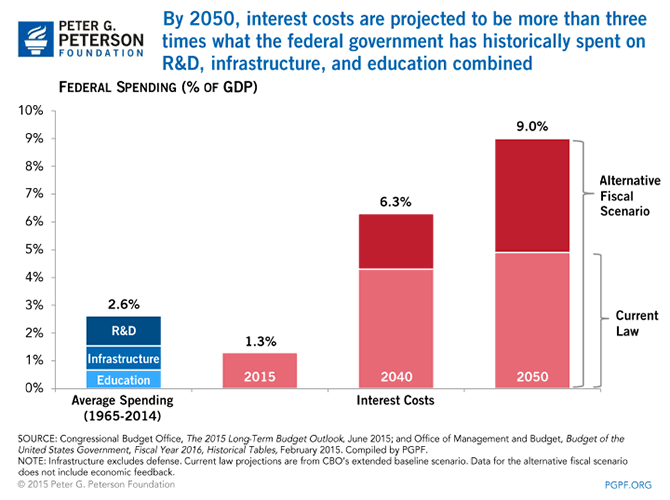
By 2022, CBO projects that interest costs alone could exceed what the federal government has historically spent on R&D, nondefense infrastructure, and education combined; by 2050, they are projected to be more than three times historical spending on those investments, as a share of GDP.
NOW IS THE TIME TO ACT
Now that America’s economic recovery is finally taking hold, there is a window of opportunity to plan for success — making smart, reasoned decisions that will benefit America over the long term. By taking action now, Congress and the President can lay a better foundation for future generations, with more investment, stronger economic growth, and a more secure safety net.
In the short term, putting the debt on a sustainable path will reassure financial markets, boost economic confidence, and reduce uncertainty — policymakers can help today’s economy by agreeing on a comprehensive plan to stabilize the debt. Over the long term, a stable fiscal policy would raise wages, bolster family incomes, and ensure a prosperous future.
Taking action now would provide time for reforms to be implemented gradually, giving Americans time to adjust to the policy changes. The longer we wait, the more difficult it will be — if we act sooner, fewer reforms will be needed to stabilize the debt.
No American wants a future in which our economy is saddled with debt, starved of investment, and struggling to grow. Only with a fiscal outlook that is stable and sustainable can we ensure that we have sufficient resources to invest in our future.
Appendix: CBO’s Two Budget Scenarios
CBO’s report includes two different budget projections: the current-law baseline and the alternative fiscal scenario (AFS).
The current-law baseline provides an optimistic projection of the nation’s fiscal future because it does not account for changes in current law that are likely to occur in the future. For example, the current law projection assumes that discretionary spending will drop to historically low shares of GDP (before stabilizing), that a number of popular tax provisions will expire as scheduled (despite the fact that lawmakers have routinely extended those provisions), and that the income tax bill for a median family will double within 25 years as real income growth pushes families into higher tax brackets.
The alternative fiscal scenario is less optimistic because it assumes that lawmakers will enact certain changes to laws so that some current policies can continue. For example, the AFS assumes that expiring tax breaks will be extended as they have repeatedly been in the past, and that discretionary spending will rise back up to its historical share of GDP in the long run. As a result, deficits and debt under the AFS are projected to be higher than under current law, resulting in a less optimistic picture of the long-term debt.
