
You are here
Spending Primer
| Facts at a Glance |
|---|
|
- Major Spending Areas
- Mandatory and Discretionary Spending
- Budget Functions
I. Where does the money go?
In 2010, the federal government spent an unprecedented $3.5 trillion, which is equal to 24 percent of the total economy or about $11,100 per person. This amount represents an elevated level of spending due to the variety of stimulus actions taken by the federal government in response to the recent economic crisis. Pre-crisis spending levels were lower, at about $2.7 trillion in 2007, which was about 20 percent of the economy or $9,000 per person.
Major Spending Areas
The President’s budget for fiscal year 2011 is over 1,400 pages long. It explains how the President proposed to spend over $3.7 trillion during that year. That is a lot of money, and it can be broken down in a number of different ways. However, it comes down to just a few categories. The largest components are Social Security, Medicare and Medicaid, defense, and net interest. These four areas of the budget alone accounted for almost two-thirds of the federal budget in 2010 (see Figure 1).
Figure 1. Composition of Spending Fiscal Year 2010 (est.)
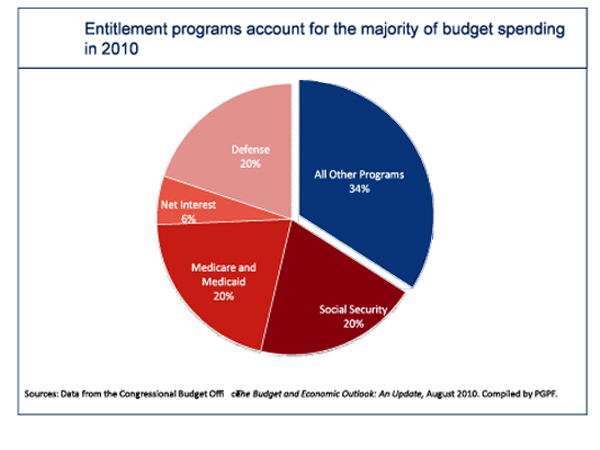
The three major entitlement programs (Social Security, Medicare and Medicaid) are the primary drivers of the long-term growth in federal spending. Of these, Medicare and Medicaid represent the greatest challenge as health care costs are growing at a steep incline.
Medicare is a program started in 1965 which provides health insurance to seniors. It is often associated with Medicaid, another large program begun at the same time, which provides health insurance to low income adults and children. The two together, along with other health programs like the veterans’ health care system, make health care the federal government’s largest spending area. It is rapidly growing larger as Americans live longer and doctors use expensive new health care technologies. Right now, we spend about 23 percent of our primary (non-interest) budget on major health care programs; by 2058 that number is projected to increase to be more than 50 percent. Per person health care costs are projected to almost quadruple by 2050, after adjusting for inflation.
Figure 2. Largest Areas of the Budget, 2010 (est.)
| Billions of dollars | Percentage of total budget | |
| Medicare & Medicaid | $720 | 21% |
| Social Security | $686 | 20% |
| Defense | $692 | 20% |
| Net Interest | $202 | 6% |
| All Other | $1099 | 34% |
| TOTAL | $3,485 | 100% |
Social Security provides income security for retirees, disabled workers, and relatives of deceased retirees or disabled workers. It was originally started as an anti-poverty program for people who had grown too old to work, but now benefits are paid to every worker who has met the program requirements upon retirement, regardless of income. Increased longevity, combined with the aging of the 78 million Baby Boomers, will have a large impact on the continued solvency of our nation’s retirement programs, as will the rise in health care costs.
Defense spending accounted for 20 percent of total spending in 2010. That’s over $2,000 per person, per year spent on defense. The U.S. defense budget is larger, in fact, than that of the next 14 largest defense budgets combined. Defense spending includes spending for personnel, research and development, and operations and maintenance, among other things.
Net interest, or the money paid each year to finance the debt accumulated from previous years’ deficits, is another large category of spending. At $202 billion, it is projected to take up about 6 percent of the budget in 2010. Importantly, this number is poised to get much bigger in the near future; by 2020, we are projected to spend more than $2 billion a day on interest payments alone.
The remaining third of the budget is left for all of the other services and programs provided by the federal government. These include education, transportation, regulatory services, research and development, agriculture subsidies, and funding for our three branches of government.
Figure 3. Composition of the Federal Budget, 1950-2010
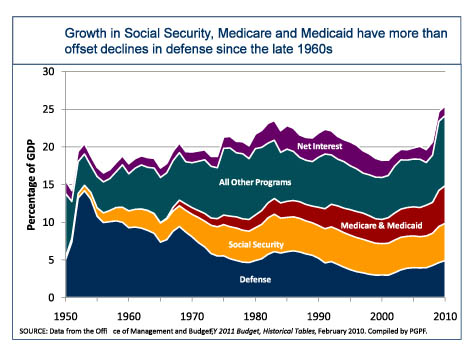
The composition of the federal budget has changed substantially over the last 60 years (see Figure 3). While the defense spending sounds (and is) high at 20 percent of the budget in 2010, in the 1950s it represented almost 70 percent of total spending. The decline since then in defense spending has been offset by the concurrent growth in the major entitlement programs, which have been growing as a percentage of the budget since the 1960s. Figure 3 shows that, spending on Social Security, Medicare, and Medicaid has been growing relatively steadily as a percent of the economy since their inceptions.
The composition of government spending is complex, as changing priorities are reflected in a constantly changing budget. Further complicating this are the occasionally misleading or under-informed reports in the media. Politicians and journalists discuss whether the government should be spending less or more than it currently is. There are calls to return to more fiscally responsible days, to “cut government waste” (with no clear definition of what “waste” is), reduce “foreign aid” (although it accounts for a much smaller piece of the budget—under 2 percent—than most polled Americans believe), or put more money into “investments for our future.” But the public debate often ignores the underlying trends and projections that are creating a growing gap between federal spending and federal revenues.
Because the value of money changes over time, it is helpful to compare the deficit and debt to the gross domestic product (GDP), a measure of all the economic output that takes place in the U.S. each year. Spending as a percentage of GDP has grown from its historical average of 20 percent of GDP over the last 50 years to roughly 24 percent of GDP in 2010, and is projected to continue to grow even after the economy has recovered, reaching 39 percent of GDP in 2040 under current policies.
Mandatory and Discretionary Spending
A different way of thinking about these same trends in spending composition can be seen in the shifts over time in mandatory and discretionary spending.
Mandatory spending is sometimes referred to as being on “auto-pilot,” meaning that it is automatically funded each year without the requirement that the Congress and the President adopt legislation to pay for it. Entitlement programs—like Social Security, crop insurance, student loans, Medicare and Medicaid—are considered mandatory programs. Entitlement programs provide benefits only to individuals that meet certain eligibility requirements, so spending for entitlements each year thus depends heavily on the number of citizens who qualify for the benefits. Mandatory spending also includes interest payments on the federal debt.
Discretionary spending is allocated at the “discretion” of the Congress and the President; that is, the Congress and the President set discretionary spending each year through annual appropriation action . Discretionary spending includes both defense and non-defense programs. Non-defense discretionary spending includes national parks, the Federal Bureau of Investigation, the Federal Aviation Administration, transportation programs, the Congress and the White House, elementary and secondary education, and State Department, and many, many more federal activities.
Figure 4. Mandatory and Discretionary Spending: 1970-2040
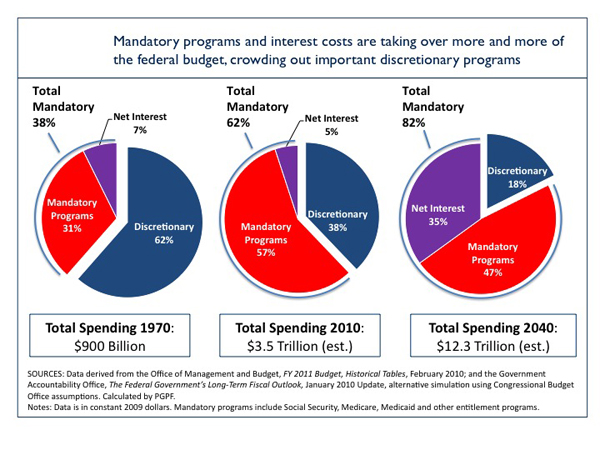
Figure 4 outlines the patterns of mandatory and discretionary spending over the last 40 years. As mandatory spending has become a larger and larger portion of the federal budget, the Congress and President have fewer opportunities to control or transform the patterns of discretionary spending. Since the 1930s, the government has taken an increasing number of steps to ensure basic standards of living to those who are at or below the poverty line, those who become disabled and cannot work, children, widows, and the elderly. These programs all fall under the category of mandatory spending. Because of their automatic funding, described above, mandatory programs have grown at a faster pace than programs that fall under discretionary spending. This trend can be seen in Figure 4—mandatory spending has grown from 38 percent of the budget in 1970 to 62 percent of the budget this year, and is only projected to keep growing into the future.
Budget Functions
Another useful way to view the budget is by broad spending categories, known as budget functions. Budget functions are used in the budget process, and also serve as a useful way to look at spending trends over time since they are more program-focused. There are 20 functions, the largest of which are Social Security, National Defense, and Income Security. Click here for a more detailed listing of the functions.
II. Conclusion
The federal government spends money on many programs and activities. The funds benefit individuals, and businesses, and many programs that affect our daily lives. Because of this, it can be difficult for elected officials to redefine priorities, or to stop the spending for programs that have outlived their usefulness or could be more effectively funded through other means. Entitlement programs like Social Security and Medicare are some of the most universally popular, but as they grow, fewer resources are available for other needs. In the short term, the focus should be on economic and employment recovery, but we will need to address our structural deficits in the medium and longer terms if we are to return to a path of fiscal responsibility, and have the resources to invest in our future.
Reports
Budget of the U.S. Government: Fiscal Year 2011 (The Office of Management and Budget)
Economic Budget Outlook: Fiscal Years 2010 to 2020 (The Congressional Budget Office)
Long-Term Budget Outlook: June 2010 (The Congressional Budget Office)
Other Resources
Budget Function Classifications—Origins, Trends, and Implications for Current Use (The Government Accountability Office)