You are here
Analysis of the President’s Fiscal Year 2013 Budget
Introduction
The President's Budget for Fiscal Year 2013 projects that the budget deficit will gradually decline under the President's policies from $1,327 billion in 2012 to $704 billion in 2022. However, this projection should provide little comfort. By 2022, federal debt will be 77 percent of gross domestic product (GDP), higher than it has been at any point in our history since 1950 and substantially above its average of 37 percent of GDP for the past 50 years.
More worrisome is the fact that debt in 2022 will be high at a time when large numbers of baby-boomers will be retiring, becoming eligible for Social Security and Medicare and placing new demands on those programs. Combined with the continued fast growth of health costs, entitlement spending is expected to surge in the decade after 2022 while revenues are expected to remain flat.
Yet, the President's budget does not address the fundamental drivers of our long-term deficits: nor does it put the budget on a sustainable path for the long run. Even by the President's own long-term numbers--which are highly optimistic because they assume that discretionary spending will be maintained indefinitely at historically low levels as a percentage of GDP and that growth of health care costs will slow significantly--the debt path rises to levels in the long run that could threaten the growth of our economy and risk a fiscal crisis.
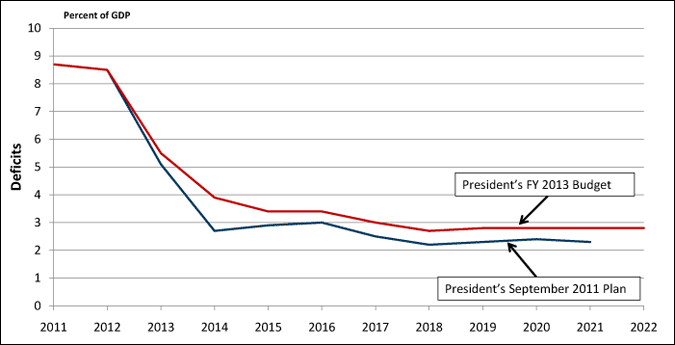
Moreover, the President's FY 2013 budget is less ambitious than his recommendations for the "Supercommittee" that were published last fall. In September, the President had proposed policies that would reduce the deficit to 2.3 percent of GDP by 2021. Under the FY 2013 budget, however, the deficit falls to only 2.8 percent of GDP in 2021.
The budget process now moves to the Congress, where members of the House and the Senate will begin debating spending and revenue legislation for the next fiscal year. This provides a new opportunity for lawmakers to work in a bipartisan fashion to address our long-term structural deficits. The long-run challenges facing the United States are daunting, and substantial changes in both spending and revenues will be needed to put the budget on a sustainable track. Credible, bipartisan solutions exist that could be implemented gradually when the economy is stronger. The sooner we commit to such a plan, the better.
The President's FY 2013 budget
| 2012 | 2013 | 2022 |
10-year total: 2013-2022 |
|
|---|---|---|---|---|
| Billions of dollars | ||||
| Revenue | $2,469 | $2,902 | $5,115 | $40,274 |
| Spending | $3,796 | $3,803 | $5,820 | $46,959 |
| Deficits | $1,327 | $901 | $704 | $6,684 |
| Debt held by the public | $11,578 | $12,637 | $19,486 | N/A |
| Percent of GDP | ||||
| Deficits | 8.5 | 5.5 | 2.8 | 3.3 |
| Debt held by the Public | 74.2 | 77.4 | 76.5 | N/A |
ECONOMIC ASSUMPTIONS
The administration projects that our economy's recovery will continue to be slow. The unemployment rate is projected to remain above 6 percent until 2017--almost a decade after the recession began in December 2007. These projections are consistent with historical evidence showing that, after a financial crisis, economies recover very slowly. The Congressional Budget Office (CBO) presented a similarly pessimistic forecast in its latest report.
The administration's economic forecast also highlights the retirement of the baby boom generation, a major development in our economy in coming years. As baby boomers leave the workforce over the next two decades, the growth of the labor force will slow, which will push down economic growth. Thus, even after the economy recovers, the administration projects that economic growth will be substantially slower than it averaged during the post-World War II period. While the economy grew 3.2 percent each year on average since 1947, real economic growth is projected to slow to 2.5 percent by the end of the decade.
The administration's forecast for real GDP in 2013 is more optimistic than CBO's current-law forecast. However, that difference stems from different assumptions about policy, not from different views about the underlying strength of the economy. CBO's forecast assumes that the tax cuts expire at the end of 2012; the administration assumes that they expire only for high-income families.
COMPARING THE PRESIDENT'S BUDGET TO THE RECOMMENDATIONS TO THE SUPERCOMMITTEE
Although budget deficits under the President's FY 2013 budget are projected to stabilize at 2.8 percent of GDP in 2019, they are much higher than they were under the recommendations that the President submitted to the Joint Select Committee on Deficit Reduction (the Supercommittee) in September 2011. Under that earlier proposal, budget deficits were projected to fall to 2.3 percent of GDP by the end of the decade (see figure below).
Deficits in the President's FY 2013 budget are higher than those in the administration's September 2011 plan submitted to the Supercommittee

Percentage of GDP
SOURCE: Data from the Office of Management and Budget, Budget of the United States Government, Fiscal Year 2013, February 2012 and "Living Within Our Means and Investing in the Future: The President's Plan for Economic Growth and Deficit Reduction," September 2011. Compiled by PGPF.
COMPARING THE PRESIDENT'S BUDGET TO ALTERNATIVE BASELINES
One of the most confusing aspects about the public debate on the budget stems from the proliferation of baselines against which policy proposals are measured. Depending on the baseline that is chosen for comparison, advocates can make a budget's impact appear positive--or negative.
Ideally, a baseline should be a neutral benchmark against which to measure policy proposals. For many years, current-law was the standard baseline. However, over the past decade, it has become increasingly common for budget analysts to make adjustments to the current-law baseline to reflect the fact that policymakers have routinely extended some policies that were scheduled to expire. For example, in every year since 2003, policymakers have overridden the reductions in physician reimbursement rates under Medicare that are required under current law. The adjusted baselines generally include the costs of that "doc fix" as well as the costs of extending several expiring policies in order to create a baseline that aims to better reflect the budgetary effects of continuing current policies.
In the President's Budget, the Office of Management and Budget (OMB) prepares two baselines. The first is called the "BEA baseline," which is similar to a current-law baseline except that OMB does not include the effects of the Budget Control Act that was passed in the summer of 2011. The second is called the "adjusted baseline," which assumes the implementation of the Budget Control Act and the policies that OMB assumes will continue, such as the "doc fix" and the tax cuts that were initially passed in 2001 and 2003.
Construction of the President's adjusted baseline
|
10-year deficits: 2013-2022 |
|
|---|---|
| BEA baseline | $4,718 |
| Adjustments | |
| Budget Control Act provisions | -$1,757 |
| Index the AMT | $1,898 |
| Extend 2001/2003 tax cuts for households | $2,173 |
| Extend estate, gift, and generation-skipping transfer taxes | $431 |
| Medicare "doc fix" | $429 |
| Increase maximum Pell Grant Award levels | $50 |
| Budget for emergency spending | $80 |
| Debt service | $640 |
| TOTAL ADJUSTMENTS | $3,945 |
| Adjusted baseline | $8,663 |
Billions of dollars
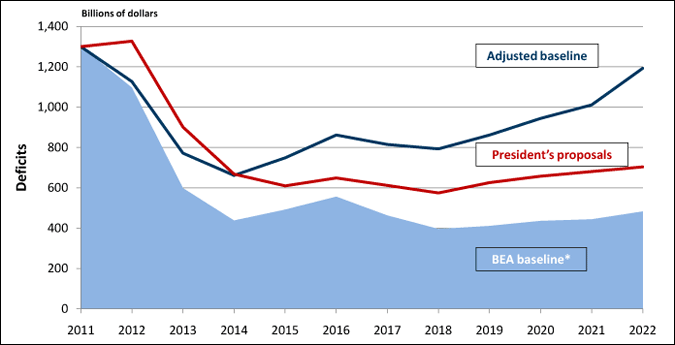
Depending on the baseline, the President's FY 2013 budget can appear to have vastly different effects on deficits. Compared to OMB's BEA baseline, the President's proposals increase the deficit. Those results stem largely from the President's proposal to extend the middle-class tax cuts that expire under current law. By contrast, his proposals reduce the deficits when compared against the budget's "adjusted baseline" because he does allow other tax cuts to expire.
Deficits under the President's budget are higher than those under the BEA baseline, but lower than those under the adjusted baseline

Billions of dollars
|
10-year deficits: 2013-2022 |
|
|---|---|
| Comparison with BEA baseline | |
| BEA baseline | $4,718 |
| Effect of President's proposals on deficits | $1,966 |
| Resulting deficits in President's FY 2013 budget | $6,684 |
| Comparison with adjusted baseline | |
| OMB's adjusted baseline | $8,663 |
| Effect of President's proposals on deficits | |
| New proposals | -$3,173 |
| Eliminate the automatic reductions from the Supercommittee's failure | $1,195 |
| Net effect of President's proposals | -$1,978 |
| Resulting deficits in the President's FY 2013 budget | $6,684 |
SOURCE: Data from the Office of Management and Budget, The Budget of the United States Government, Fiscal Year 2013, February 2012. Compiled by PGPF.
Although the President has been credited by some for advancing new proposals that would reduce deficits by $3.2 trillion over 10 years, he also proposed cancelling the $1.2 trillion of automatic spending reductions that would have stemmed from the failure of the Supercommittee. Thus, the net effect of the President's proposal relative to the adjusted baseline is just under $2 trillion.
THE BUDGET CONTROL ACT
As part of an agreement to increase the debt ceiling (which limits total federal borrowing) last August, the President and the Congress enacted the Budget Control Act (BCA) of 2011. The BCA set caps on the levels of discretionary spending through 2021. It also created a special committee, the Joint Select Committee on Deficit Reduction, tasked with identifying an additional $1.5 trillion in deficit reduction through 2021. The failure of this "Supercommittee" (as it came to be known) to achieve any agreement kicked off a process that, under current law, will reduce the deficit by $1.2 trillion over the 2013 to 2021 period through automatic, across-the-board cuts in discretionary spending and certain mandatory programs. The BCA requires that these cuts begin in January 2013, with half of the reductions coming from the defense budget. Some programs--such as Social Security, veterans' benefits, and Medicaid--are exempt from the automatic cuts; in addition, Medicare reductions are limited to 2 percent of costs.
POLICY PROPOSALS
The President's 2013 budget is the first detailed budget to be submitted since the enactment of the Budget Control Act of 2011 or BCA (see box). Given the new constraints, the administration seeks two goals with its budget. The first is to keep funding for discretionary programs within the spending caps set by the BCA, and the second is to avoid the automatic spending reductions that are scheduled to start in January 2013 by substituting a combination of savings that come largely from health care programs and new revenues. These proposed policy changes with debt service would offset the $1.2 trillion that the automatic reductions would produce over the 2013-2022 period.
To meet those two objectives, the budget proposes substantial changes to current spending and revenue policies. On the spending side, changes in discretionary spending will contribute a significant portion of the total amount of deficit reduction in the budget, largely because of the caps established in the BCA. The budget proposes modest reductions in health care programs, but they would remain the fastest growing category of the budget. On the revenue side, the President would increase taxes, primarily on high-income taxpayers (singles who make at least $200,000 per year and joint filers who make $250,000 or more).
Spending
Total spending under the President's budget would grow by about $8 billion, or 0.2 percent, between 2012 and 2013. Over the next decade, the budget projects that total spending would increase by $2 trillion, rising from $3.8 trillion in 2012 to $5.8 trillion in 2022. Social Security, health care and interest costs would account for almost all of the increase, while spending on defense and other domestic programs would grow more slowly than the economy.
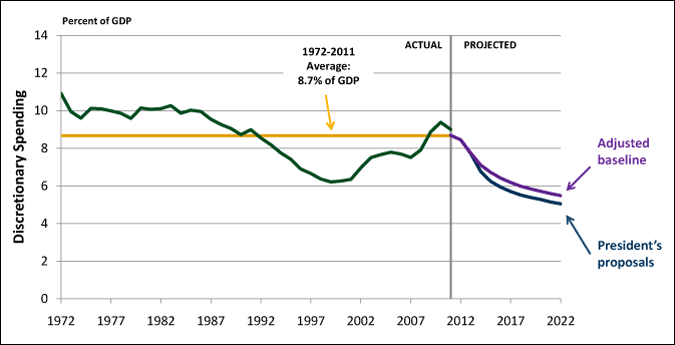
Total discretionary spending, which is constrained by the BCA caps, would remain relatively flat in nominal dollars over the next ten years. The budget keeps spending below the caps. It projects total discretionary spending of $1.32 trillion in 2013 and $1.29 trillion in 2022--a 2 percent decrease in nominal dollars. As a percentage of GDP, discretionary spending would decline from 7.7 percent of GDP in 2013 to 5.0 percent of GDP in 2022.
Discretionary spending in the President's budget drops far below historical averages
Percentage of GDP
SOURCE: Data from the Congressional Budget Office, The Budget and Economic Outlook: Fiscal Years 2012 to 2022, January 2012; and the Office of Management and Budget, The Budget of the United States Government, Fiscal Year 2013, February 2012. Compiled by PGPF. NOTE: The gap between historical and projected discretionary spending in FY 2011 is due to a reclassification of surface transportation outlays from discretionary to mandatory in the President's 2013 budget.

Defense
The administration's new defense strategy, which would increase America's presence in the Asia/Pacific region and maintain vigilance in the Middle East while ending the Iraq and Afghanistan wars, is designed to conform defense spending to remain within the BCA caps. The defense budget focuses on developing new unmanned aerial weapons systems, enhances the Department of Defense's cybersecurity efforts, and funds anti-proliferation and nuclear modernization efforts.
Under the administration's plan, defense spending would decline in nominal dollar terms, falling one percent from 2012 and 2013 (including spending for Overseas Contingency Operations--or OCO). In 2012, the budget estimates $709 billion in defense spending, or 4.5 percent of GDP. In 2022, defense spending is projected to decline to $650 billion--or 2.5 percent of GDP--under the President's budget. That would be even less than the amount projected in last month's CBO baseline which included the automatic reductions to defense spending scheduled to go into effect next year under the BCA.
To restrain costs, the budget proposes reforms to TRICARE, the military's health care program, including increased co-pays, higher enrollment fees for TRICARE Prime (the most comprehensive TRICARE plan), and small annual fees for TRICARE members over 65 transitioning to Medicare. Changes in TRICARE revenue collection will reduce 5-year DOD costs by $13 billion. The budget also calls for a new Military Retirement Modernization Commission; if approved, this commission will work with the President and the DOD to review the current structure of the military retirement system and draft legislation to reform it.
Non-Defense Discretionary
Guided by the BCA caps, the budget proposes to reduce non-defense discretionary spending by more than $40 billion between 2012 and 2013. Over the next decade, spending in this category of the budget would average just under $600 billion per year. As a share of the economy, non-defense discretionary spending would decline from 3.5 percent of GDP in 2013 to 2.5 percent of GDP in 2022.
Health Care
The budget would achieve about $360 billion in savings over 10 years from Medicare and Medicaid, but it avoids major structural reforms. Over that same period, the budget projects that Medicare costs will increase by 90 percent, while the costs for Medicaid and other health care entitlements increase by 150 percent.
Within Medicare, 90 percent of proposed savings are achieved through reduced payments to providers including changes in pharmaceutical drug payments, post-acute care rates, and payments for graduate medical education. The remaining savings would result from premium increases and other charges to higher-income beneficiaries and from cutting the Medicare growth rate target for the Independent Payment Advisory Board (IPAB) from GDP plus one percent to GDP plus 0.5 percent. (This growth-rate target is used to trigger IPAB cost-containment recommendations.) The budget also calls for reform to Medicare's "Sustainable Growth Rate" formula, which is scheduled to cut payments to Medicare providers by 28 percent this year. Instead of offsetting the cost of this "doc fix" proposal, the administration argues for a baseline adjustment that would recognize repeated annual waivers of the SGR formula reductions and assume the permanent extension of current rates.
Revenues
Under the President's Budget, revenues would rise from their current level of 16 percent of GDP to about 20 percent in 2022. That increase reflects both an improvement in the economy (which boosts taxable incomes) and changes in tax policy. Compared to the budget's adjusted baseline, revenues under the proposal are $1.9 trillion higher over the 2013 to 2022 period. However, the administration's baseline assumes extension of the 2001/2003 individual tax rate cuts, a permanent fix to the alternative minimum tax, and extension of the estate and gift taxes at current parameters. These proposals increase deficits by $4.3 trillion over 10 years.
The budget does not propose comprehensive tax reform to broaden the base, lower the rates and simplify the tax code. Many economists have suggested such reforms will be necessary to encourage a stronger economy, create a more efficient tax system, and raise revenues to address our long-term deficits. Instead, the budget proposes higher taxes for high-income earners ($1.4 trillion over ten years) and a number of tax loophole closers that the administration argues are the beginning of a national conversation about tax reform. The budget also provides for various tax deductions and credits intended to promote job creation. While these changes could aid the economic recovery in the short-term and would raise more revenues, they add further complexity to an already confusing tax code.
The most significant proposals do the following:
- Reinstate the 36 percent and 39.6 percent marginal tax rates for high-income households (families with annual incomes of $250,000 or more and individuals with annual incomes of at least $200,000). These changes would return the top rates to Clinton-era levels. The budget would continue the 2001/2003 tax cuts for incomes below these amounts.
- Reinstate the estate and gift taxes to 2009 levels.
- Reduce the value of itemized deductions to 28 percent of tax liability for individuals making over $200,000 and families making over $250,000 a year.
- Tax long-term capital gains at 20 percent and qualified dividends as ordinary income for high-income taxpayers.
- Impose a financial crisis responsibility fee on bank holding companies and other financial institutions with assets over $50 billion.
- Extend the American Opportunity Tax Credit, a credit designed to offset higher education expenses.
- Make the research and experimentation tax credit permanent.
- Provide tax breaks for manufacturing and change the tax treatment of international income.
- Index the Alternative Minimum Tax for inflation.
Interest
Over the 10-year budget period, federal interest costs would rise from $225 billion in 2012 to $850 billion in 2022--more than doubling as a share of GDP. By 2022, interest will cost nearly as much as the $856 billion projected for national security, which includes defense, international affairs, and homeland security programs.
THE LONG-TERM OUTLOOK
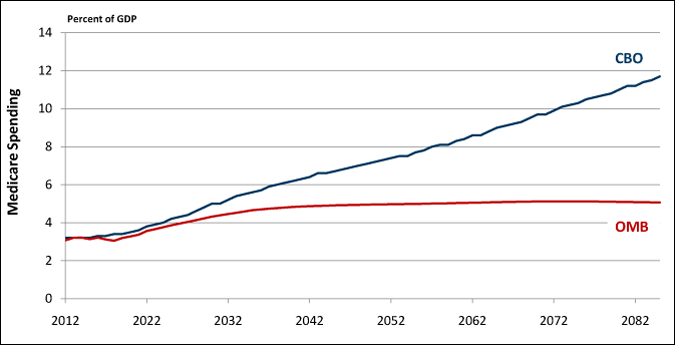
The President's budget demonstrates why a 10-year budget outlook is not long enough. Although it would stabilize debt as a percentage of GDP over the next 10 years, the debt trajectory would rise dramatically over the long term as deficits persist, the population ages, and health care costs grow. Because the budget does not address these underlying drivers of the long-term fiscal challenge, by 2034, the debt-to-GDP ratio would surpass 90 percent--a threshold that many economists view as risky to economic growth.
Any long-term projection is highly uncertain. But the administration's base long-term projections reflect several optimistic assumptions. The projections assume that discretionary spending would remain well below its 30-year average, and that growth in long-term Medicare costs would slow to a rate of 0.2 percent per enrollee above GDP growth per capita, or about one-tenth as fast as its historical growth rate. Should either of those assumptions turn out less favorably, the debt's long-term path would steepen sharply.
SOURCE: Data from the Office of Management and Budget, The Budget of the United States Government, Fiscal Year 2013, February 2012 and the Congressional Budget Office, CBO's 2011 Long-Term Budget Outlook, June 2011. Compiled by PGPF.

CONCLUSION
Last year's Budget Control Act and President Obama's proposed 2013 budget are small steps toward addressing our nation's fiscal challenges. Both Congress and the administration need to go much further. The real threats to America's long-term economic future are long-term: structural deficits driven by rapidly rising health care spending, an aging population, and inadequate revenues that together result in massive interest costs that would burden our nation for decades. To address our long-term fiscal and economic challenges effectively, we need a bipartisan plan that fully tackles all of the major unsustainable areas of the federal budget. A plan can be developed now that allows for measures to aid the economic recovery in the short term, and simultaneously commits to major long-term structural reforms to the budget to be implemented later when the economy is stronger. Despite the political challenges of reaching bipartisan solutions, a number of groups have developed comprehensive, long-term reform proposals. Solutions exist--it is up to our leaders to act on them.
APPENDIX
FY 2011 FINANCIAL REPORT OF THE U.S. GOVERNMENT -- DIFFERENT MEASURES, SAME CONCLUSION
The Financial Report of the U.S. Government, released at the end of 2011, provides another sobering picture of the country's long-term fiscal challenges. Prepared by the Department of the Treasury and the Office of Management and Budget, the Financial Report uses accrual accounting to present the country's financial condition, including its promises for the future. Unlike the cash accounting methodology used in the President's Budget, which records a cost when it is paid out, accrual accounting recognizes that expenses can be taken on well before the cash outlay actually occurs. This methodology provides a different way to look at the budget, but draws similar conclusions--large future commitments that are dramatically underfunded. Together, the President's Budget and the Financial Report give complementary perspectives and provide useful tools for policymakers to understand the fiscal challenges we face.
This year's Financial Report emphasizes the need to achieve fiscal sustainability over the long term. Government liabilities in 2011 included $10.2 trillion in public debt, $5.8 trillion in federal employee and veterans benefits, and $1.5 trillion in other liabilities. Net of $2.7 trillion in assets, the financial position at the end of FY 2011 was negative $14.8 trillion. However, the real drivers of skyrocketing long-term debt projections are promises of future spending. Although they're not considered liabilities under federal cash accounting rules, the report calculates the net present value of our social insurance promises, or how much would have to be set aside today to pay for Medicare, Social Security, and other social insurance programs for the next 75 years. Projected social insurance net expenditures added an additional $33.8 trillion (or 3.8 percent of GDP) to the government's financial promises, along with an additional $6.4 trillion in other non-interest expenditures.
Some of the methodology used in the Financial Report has been criticized by budget experts. The Financial Report assumes that Congress will allow Medicare reimbursements to decrease by 28 percent in March, as scheduled, even though Congress has waived these cuts every year since 2003. Besides being unrealistically optimistic, this assumption is also inconsistent because the report assumes the extension of other popular policies that are scheduled to expire. Auditors from the Government Accountability Office also believe that the report's projections are too optimistic, thereby understating the burden of our future health promises. Such optimistic assumptions imply that the Financial Report's already-somber outlook is likely to underestimate our future fiscal challenges.
