You are here
FY 2015 Budgets: Comparing Chairman Ryan's and the President's Proposals
This week, House Budget Committee Chairman Paul Ryan released his "Chairman’s Mark" outlining budget priorities for the coming decade. This proposal follows the release of President Obama’s budget last month. The two proposals present distinct visions of the role of the federal government in our economy.
Unfortunately, the Senate has opted not to release a budget resolution for Fiscal Year (FY) 2015, which represents a missed opportunity to present their view on the tough choices necessary in the fiscal debate. Last year, both the House and Senate proposed and passed budget resolutions for FY 2014 and worked out their differences in a conference committee. This “regular order” process allows Congress to have a full debate about the fiscal choices we face. But without a Senate budget resolution this year, Congress won’t be able to use regular order to make the necessary budgetary tradeoffs and address our fiscal challenges.
In the FY 2015 budget, Ryan proposes to bring deficits below one percent of GDP by 2017 and balances the budget by the end of the decade. The plan achieves deficit reduction entirely through spending cuts, with nearly half of these cuts coming from the healthcare programs, including the repeal of the 2010 health reform law. The Ryan plan caps the growth of Medicaid spending by turning it into a block grant to the states. It also proposes major reforms for Medicare, but those reforms would be phased in gradually and wouldn’t produce significant budgetary savings until after 2024.
It is critical for policymakers to develop plans that not only improve the fiscal outlook over the next ten years, but also put the nation’s debt on a sustainable path for the long term.
The Ryan proposal also shifts the mix of discretionary spending between defense and non-defense programs. Over the next ten years, base budgetary resources for non-defense discretionary programs would be reduced by about $800 billion, while resources for defense programs would be increased by about $500 billion.
The President’s proposal involves more modest deficit reduction. The President proposes additional stimulus spending in the short term, which increases deficits in 2014 and 2015 compared to current law. But under the President’s plan the cumulative effect of higher taxes, reduced war spending, additional savings from health programs, and immigration reform brings deficits down in later years.
Compared to the Ryan proposal, the President’s plan would raise approximately $3 trillion more in revenues, but it would also spend approximately $6 trillion more over the next 10 years. As a result, deficits under the Administration’s plan would be approximately $3 trillion higher than under the Ryan plan.
Under both plans, interest expense remains a significant drain on the federal budget. Under the President’s proposal, interest costs will be $5.6 trillion over the next 10 years, and more than $800 billion in 2024. Under the Ryan proposal, interest costs will be $4.9 trillion over the next 10 years, and more than $650 billion in 2024.
The charts below illustrate various budget trends over the coming decade under Chairman Ryan’s and the President’s proposals.
Importantly, while the 10-year perspective is the standard budgetary window, it fails to present a full picture of America’s fiscal outlook. The primary drivers of America’s long-term debt — those which pose a fundamental threat to our economy — become more fully evident in the subsequent decade and thereafter. Over this longer period, America faces a number of structural fiscal challenges: baby boomers retiring in large numbers and living longer, growing health care costs and rising interest costs, combined with a tax system that raises insufficient revenue. All of these trends threaten to crowd out the critical public and private investments that we need to make, and put the nation at risk of a future fiscal crisis. It is critical for policymakers to develop plans that not only improve the fiscal outlook over the next ten years, but also put the nation’s debt on a sustainable path for the long term.
Deficits under fiscal year 2015 budget plans
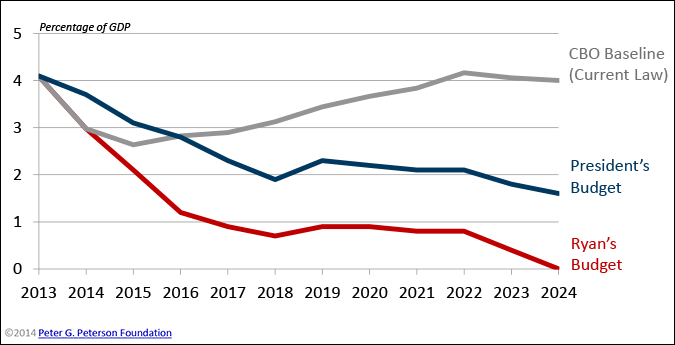
SOURCE: Congressional Budget Office, The Budget and Economic Outlook: 2014 to 2023, February 2014; the House Budget Committee, The Path to Prosperity: Fiscal Year 2015 Budget Resolution, April 2014; and the Office of Management and Budget, Budget of the United States Government, Fiscal Year 2015, March 2014. Compiled by PGPF.
NOTE: Because the Ryan budget plan does not include budgetary estimates for 2014, it is assumed that the plan will follow current law for that year. The difference in projections between CBO’s current-law baseline and the President’s budget is not due entirely to the effects of the President’s policies; some of the difference stems from the different economic and technical assumptions used by CBO and the Administration.
Debt held by the public under fiscal year 2015 budget plans
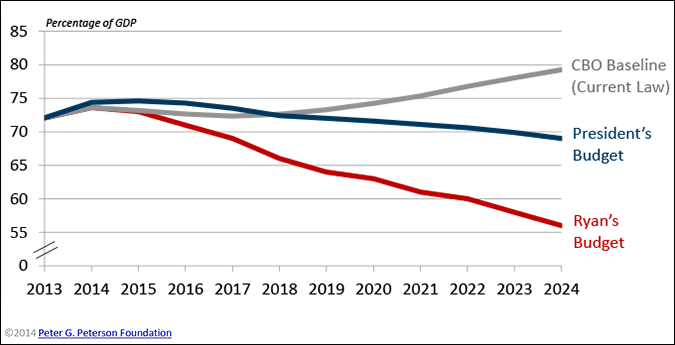
SOURCE: Congressional Budget Office, The Budget and Economic Outlook: 2014 to 2023, February 2014; the House Budget Committee, The Path to Prosperity: Fiscal Year 2015 Budget Resolution, April 2014; and the Office of Management and Budget, Budget of the United States Government, Fiscal Year 2015, March 2014. Compiled by PGPF.
NOTE: Because the Ryan budget plan does not include budgetary estimates for 2014, it is assumed that the plan will follow current law for that year. The difference in projections between CBO’s current-law baseline and the President’s budget is not due entirely to the effects of the President’s policies; some of the difference stems from the different economic and technical assumptions used by CBO and the Administration.
Total spending under fiscal year 2015 budget plans
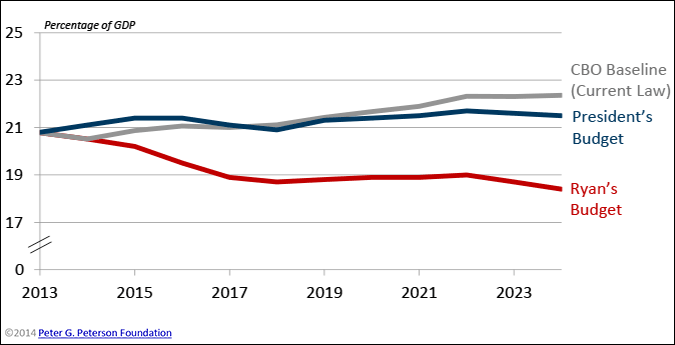
SOURCE: Congressional Budget Office, The Budget and Economic Outlook: 2014 to 2023, February 2014; the House Budget Committee, The Path to Prosperity: Fiscal Year 2015 Budget Resolution, April 2014; and the Office of Management and Budget, Budget of the United States Government, Fiscal Year 2015, March 2014. Compiled by PGPF.
NOTE: Because the Ryan budget plan does not include budgetary estimates for 2014, it is assumed that the plan will follow current law for that year. The difference in projections between CBO’s current-law baseline and the President’s budget is not due entirely to the effects of the President’s policies; some of the difference stems from the different economic and technical assumptions used by CBO and the Administration.
Revenues under fiscal year 2015 budget plans
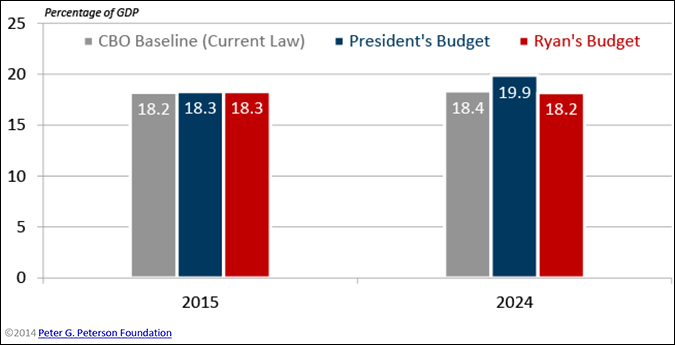
SOURCE: Congressional Budget Office, The Budget and Economic Outlook: 2014 to 2023, February 2014; the House Budget Committee, The Path to Prosperity: Fiscal Year 2015 Budget Resolution, April 2014; and the Office of Management and Budget, Budget of the United States Government, Fiscal Year 2015, March 2014. Compiled by PGPF.
NOTE: The difference in projections between CBO’s current-law baseline and the President’s budget is not due entirely to the effects of the President’s policies; some of the difference stems from the different economic and technical assumptions used by CBO and the Administration.
Medicaid and other health spending (excluding Medicare) under fiscal year 2015 budget plans
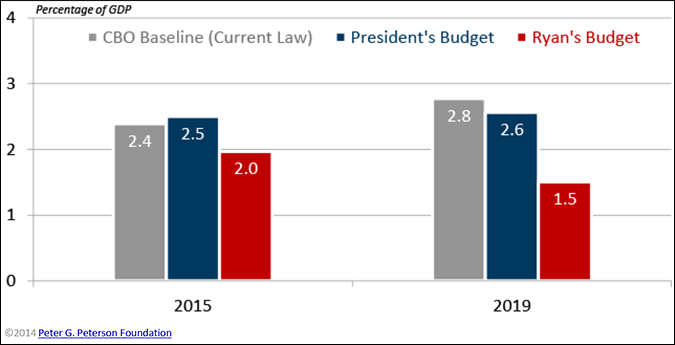
SOURCE: Congressional Budget Office, em
NOTE: Spending levels are measured as mandatory outlays for Function 550. The difference in projections between CBO’s current-law baseline and the President’s budget is not due entirely to the effects of the President’s policies; some of the difference stems from the different economic and technical assumptions used by CBO and the Administration.
Discretionary spending under fiscal year 2015 budget plans
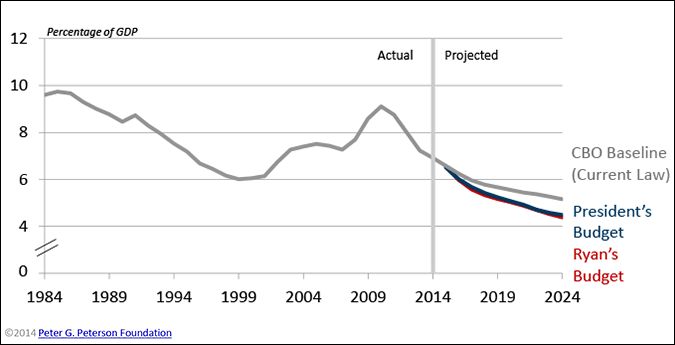
SOURCE: Congressional Budget Office, The Budget and Economic Outlook: 2014 to 2023, February 2014; the House Budget Committee, The Path to Prosperity: Fiscal Year 2015 Budget Resolution, April 2014; and the Office of Management and Budget, Budget of the United States Government, Fiscal Year 2015, March 2014. Compiled by PGPF.
NOTE: The difference in projections between CBO’s current-law baseline and the President’s budget is not due entirely to the effects of the President’s policies; some of the difference stems from the different economic and technical assumptions used by CBO and the Administration.
